

Add a control
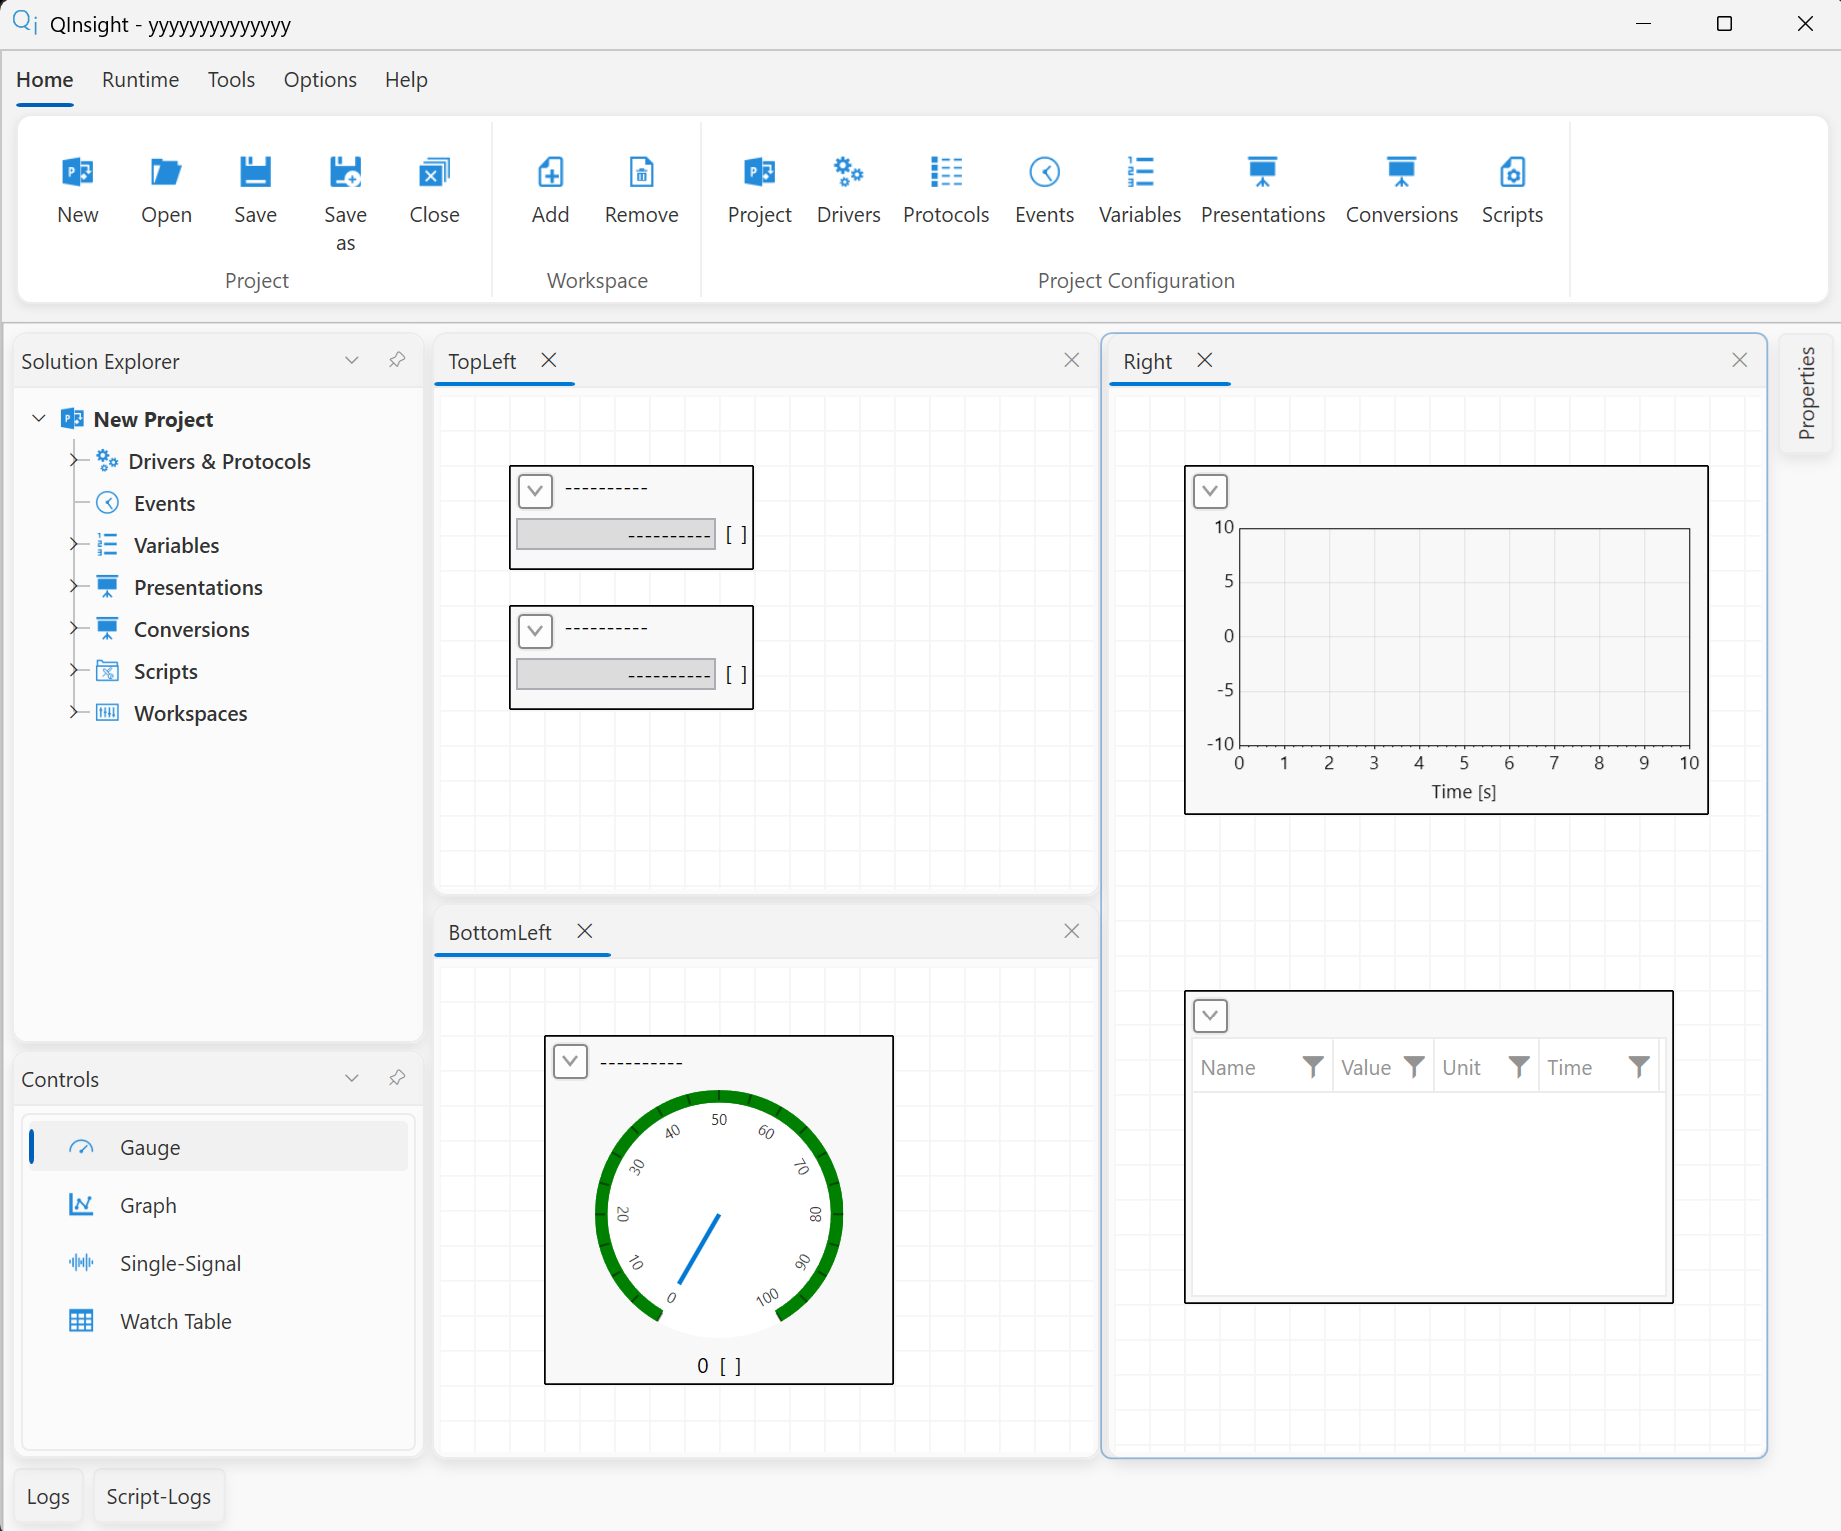
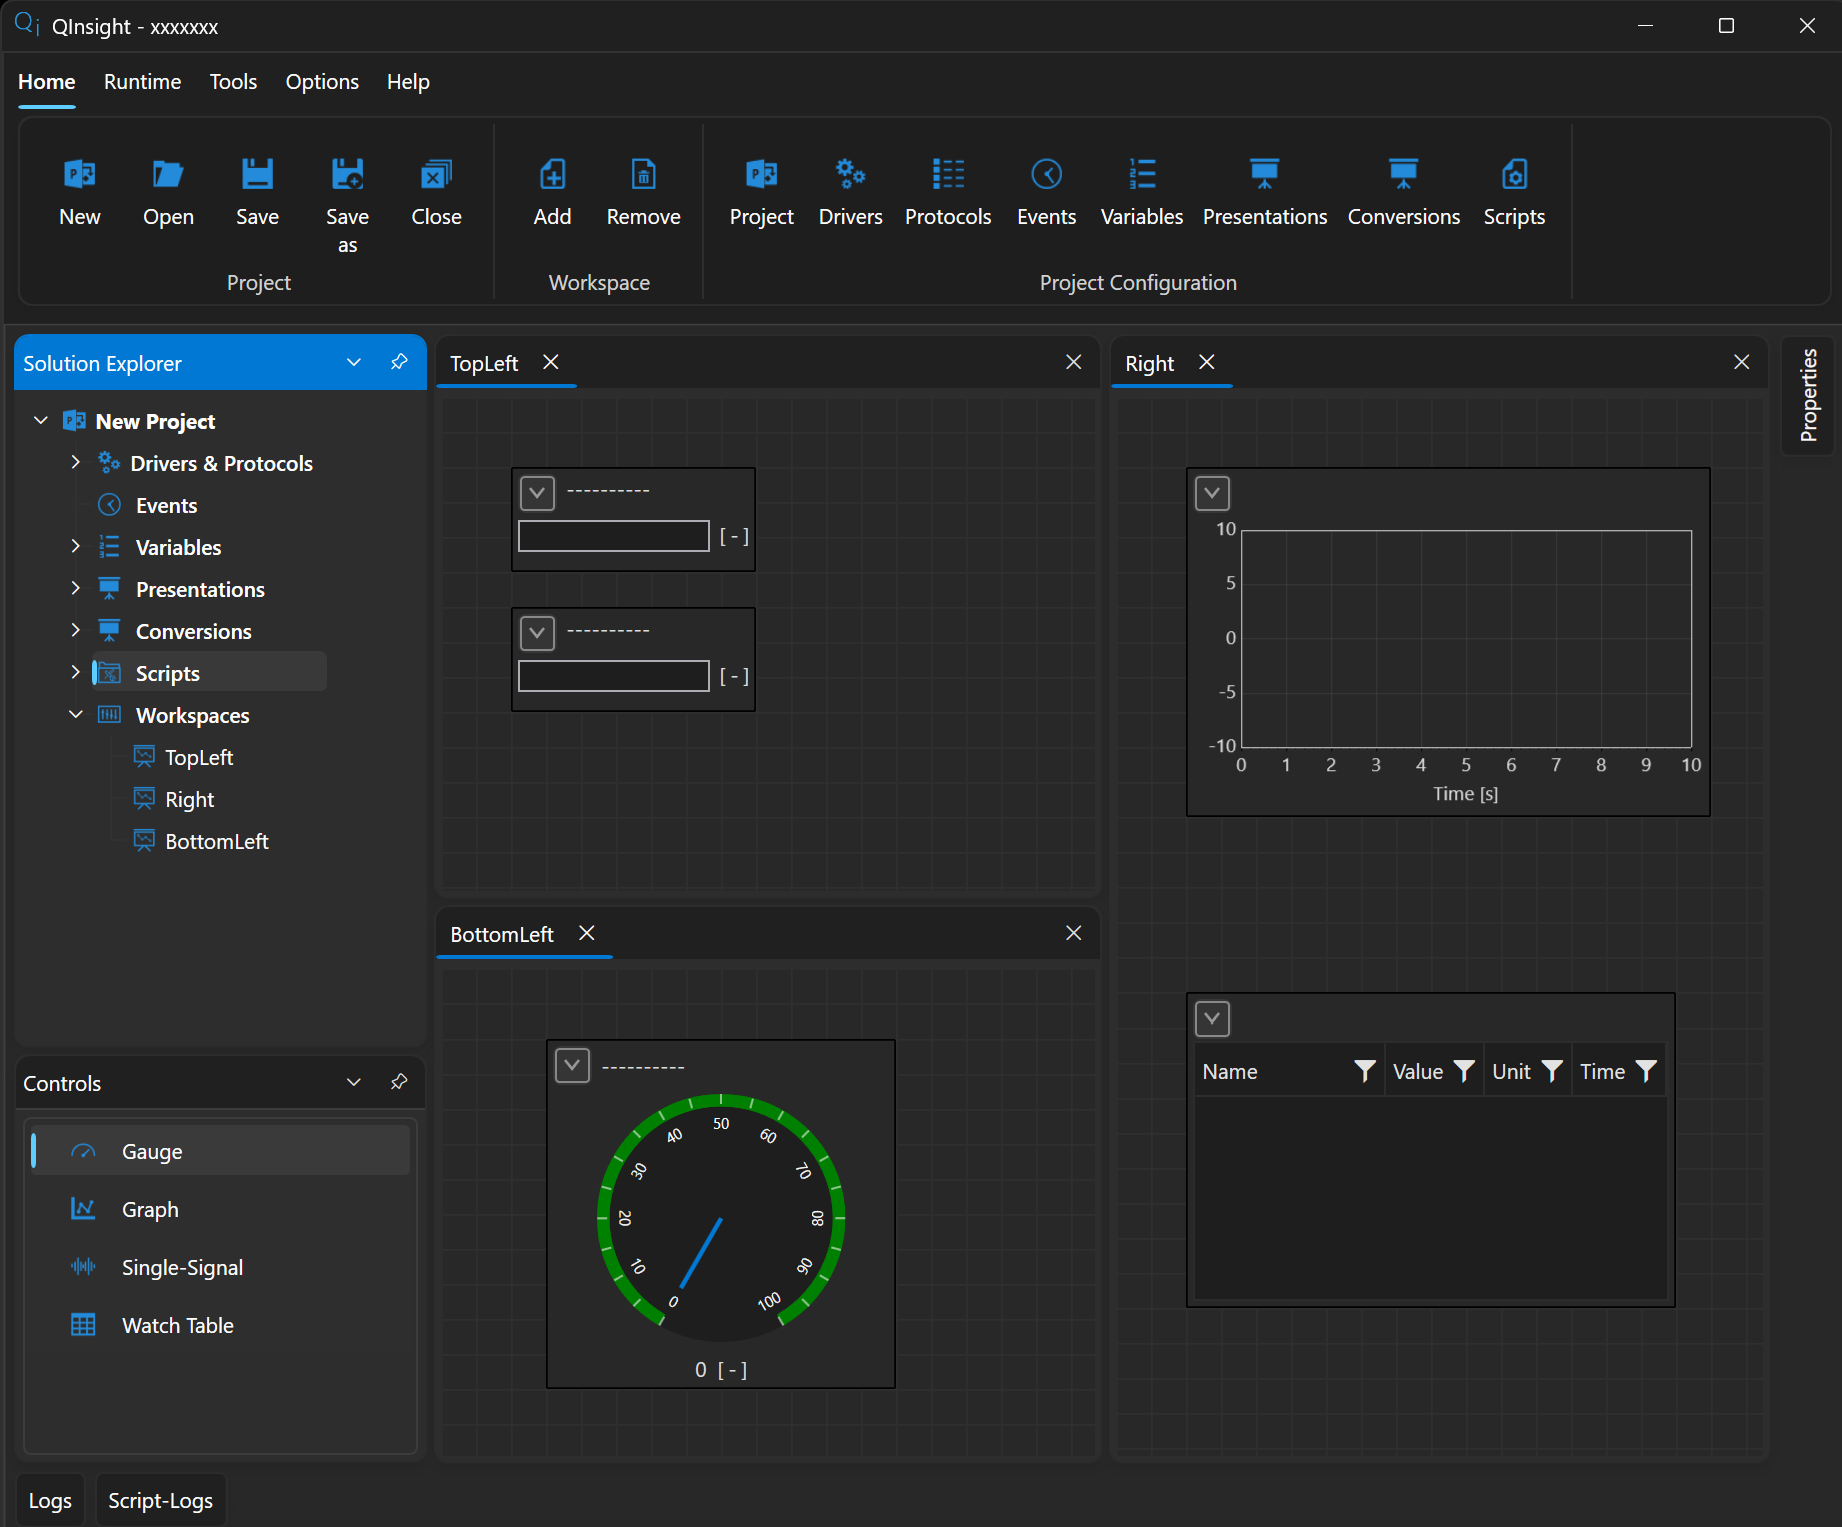
Controls are the display and control elements a workspace is made of.
QInsight ships six basic ones: Graph (signal time course), XY
Graph (signal versus signal), Gauge (a radial/linear indicator),
Single-Signal (a single value with a caption), Watch Table (a
table of variables), and Matrix (array/curve/map with cell editing). Controls are plugins (the Controls
folder next to QInsight.exe), so the set can be extended with custom
elements.
Steps
- Open the Controls panel (docked on the left).
- Drag & drop the desired control onto the workspace.
- Grab the control to move it; resize it by its edges. Placement is helped by a grid (snap to grid).
Control settings
Each control has its own settings available directly on it (expandable sections) — e.g. the time window and axes on a graph, the range and thresholds on a gauge. Common properties: position, size, background/foreground colors, and font size.
Via the context menu, a control can be locked — a locked control cannot be accidentally moved, resized, or deleted.
Next
The control does not show anything yet — it needs to be bound to a variable.