XCP on CAN on a NUCLEO-H723ZG: measurement, stimulation and calibration maps
The project Qenex_CAN_XCP_NucleoH723_Maps_FreeRTOS.qproj is in the
Examples folder next to QInsight.exe. It belongs to the
QFW SDK example firmware image examples/nucleo_h723zg
built with the DebugCan preset (FreeRTOS, CAN transport); the
bare-metal image has no CAN.
It is the CAN variant of XCP on TCP on a NUCLEO-H723ZG: the same variables, events, scripts and workspace, only the board talks over classic CAN through a PEAK PCAN-USB adapter. The eight-byte frames show clearly how QInsight combines DAQ, polling and STIM in one XCP session, why large maps are read on request and why block mode helps — and because the driver deliberately has a limited number of reconnection attempts, the example also shows what happens when you unplug the adapter while running.
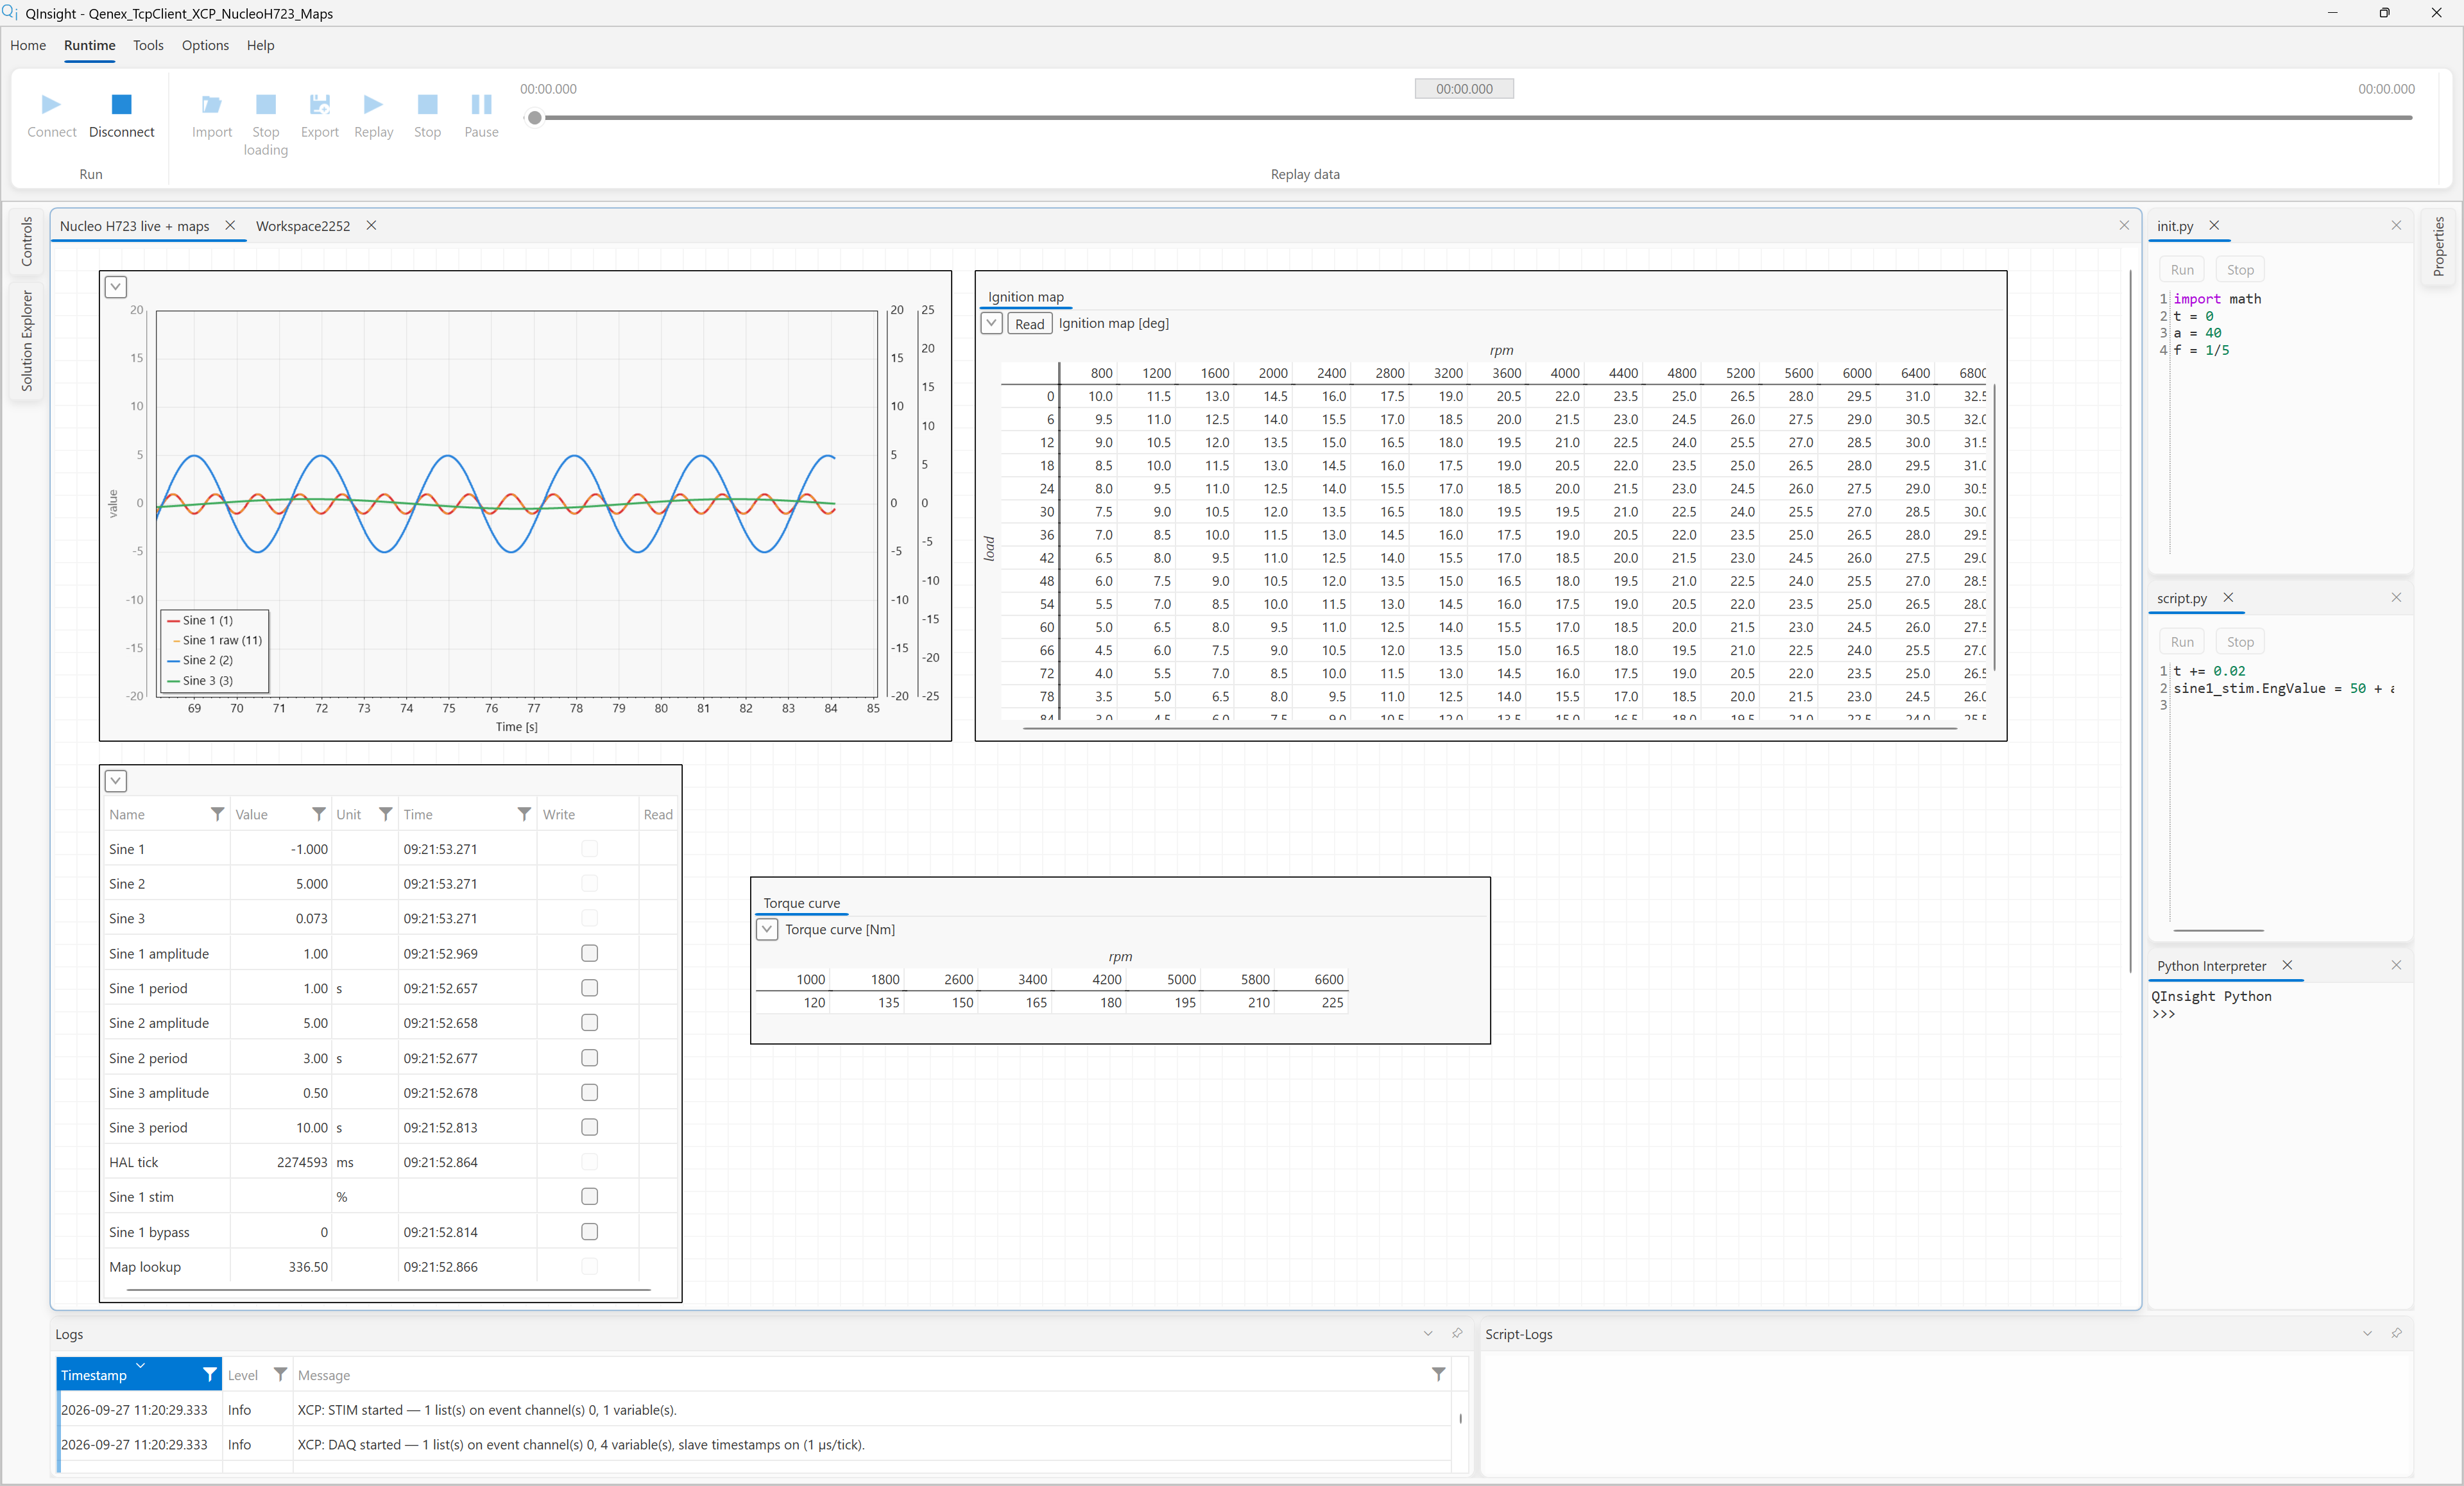
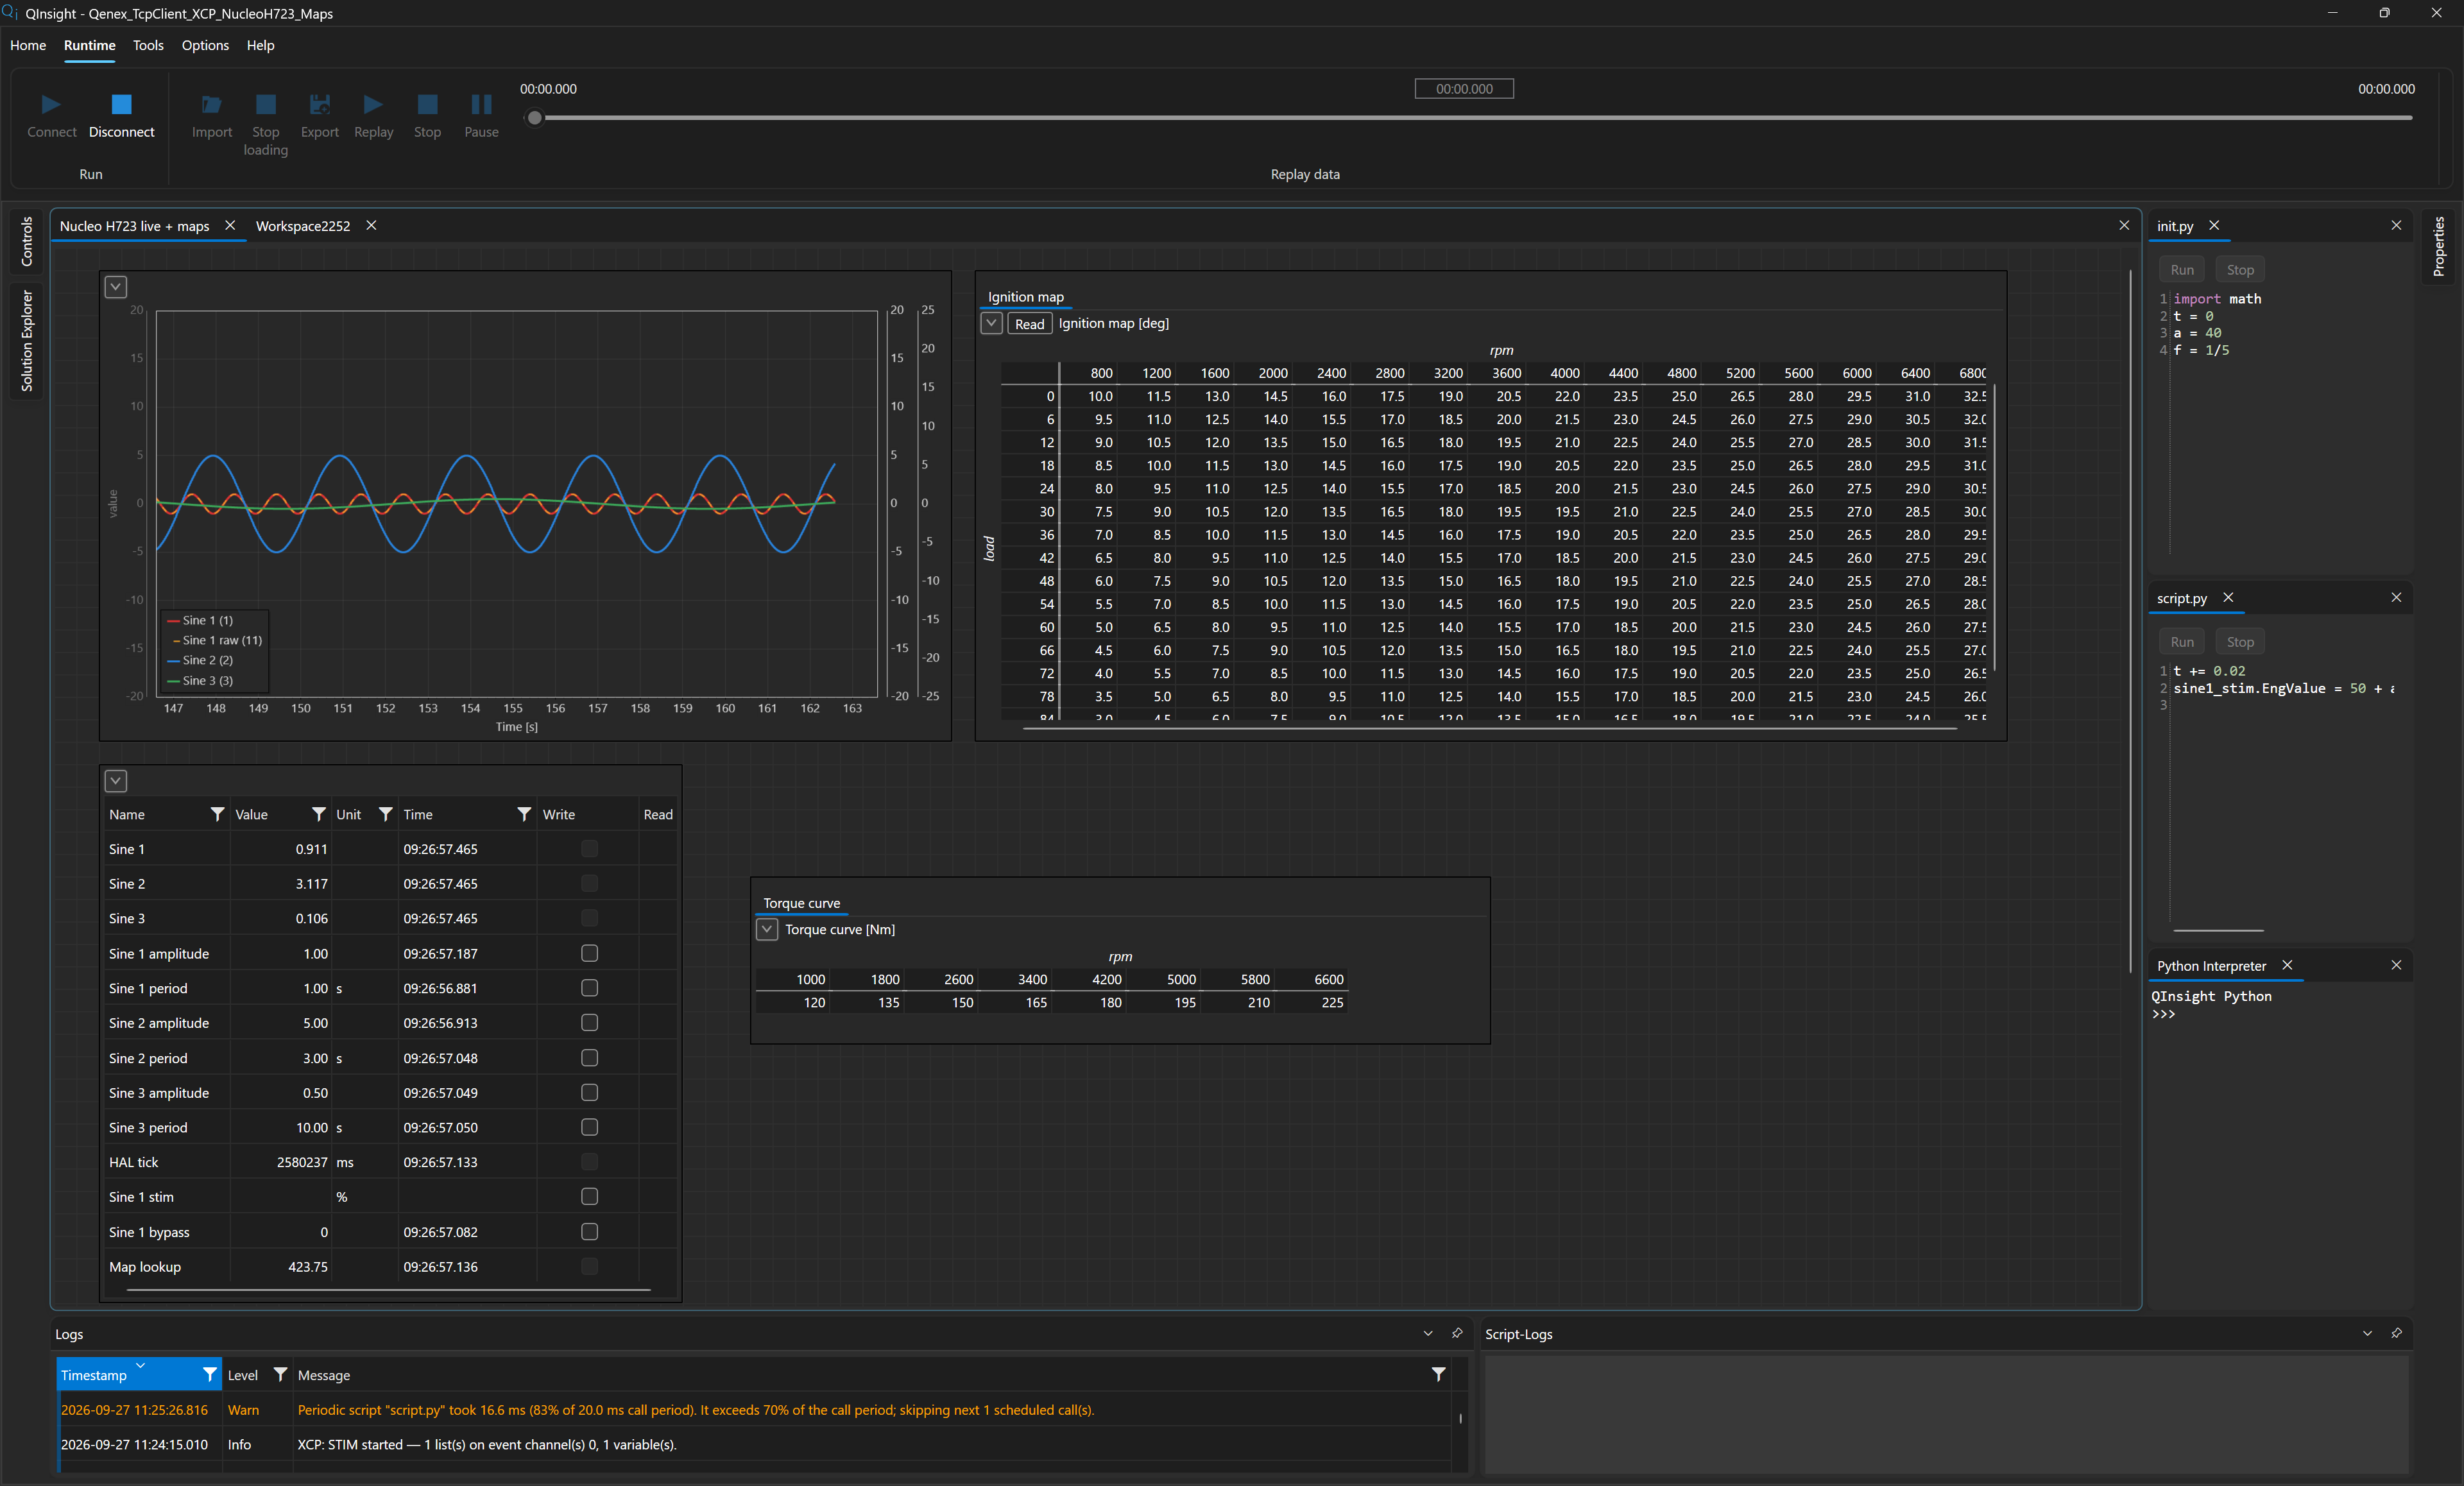
The workspace is the same as in the TCP variant:
What the example shows
- DAQ measurement — the board transmits
sine1_value,sine1_raw,sine2_valueandsine3_valueby itself on itsdemo10msevent (every 10 ms). - Calibration by polling — the amplitudes and periods of the three sines are read every 500 ms and can be written at any time.
- STIM bypass — a periodic script streams a slow sine into
sine1_stim; thesine1_bypassswitch decides whethersine1_valueis owned by the board's internal model or by the master via STIM. - Maps and a curve — the 16 × 16 ignition map and the 64 × 64 map read on request with the Read button, the torque curve polled every 500 ms, cell editing in Write Mode and writing only the changed cells.
- Reconnection with a limit —
reconnectAttempts=2: after the adapter is unplugged the driver reports the transport loss, tries to recover twice and then stops trying; the Start button starts it again.
What you need
- A NUCLEO-H723ZG board running the QFW SDK
example firmware (
examples/nucleo_h723zg) built for the CAN transport — presetDebugCan(QFW_XCP_TRANSPORT=can), see XCP on classic CAN. - A PEAK PCAN-USB adapter wired to the board's CAN interface; the bus is classic CAN, 500 kbit/s, DLC 8 frames.
- XCP identifiers master 0x200 / slave 0x201 (11-bit) — that is how both the firmware and the project have them.
- The adapter's device ID: the project has
deviceId=0xff. Replace the value with the ID set in your adapter (PEAK Settings), otherwise the driver does not find the adapter and keeps retrying according to the reconnection parameters. - Variable addresses matching your firmware build. The addresses
are absolute and come from the ELF file of the specific build (the
DebugCanpreset has different matrix object addresses thanDebug). Thetools/elf_vars_scan.pytool of the SDK package with the configurationexamples/nucleo_h723zg/nucleo_h723zg.vars.jsonadapted to theDebugCanELF reads them and exports arrays as Matrix variables. Refresh them in the project after every new firmware build, see Variable addresses for QInsight.
The project
The project contains one PEAK CAN Adapter driver with the XCP on CAN protocol, four events, seventeen variables, two scripts and the workspace Nucleo H723 live + maps with four controls.
Driver and protocol
The PEAK CAN Adapter driver
(label PCAN-USB):
| Parameter | Value | Meaning |
|---|---|---|
deviceId | 0xff | adapter ID (hexadecimal) — adjust to your adapter |
bitrate | 500000 | 500 kbit/s, classic CAN |
reconnectDelayMs | 1000 | delay between attempts to initialize the adapter |
reconnectAttempts | 2 | after two consecutive failed attempts the driver stops trying (default -1 = unlimited) |
Underneath it a single instance of the XCP on CAN protocol:
| Parameter | Value | Meaning |
|---|---|---|
masterId | 0x200 | CAN id of master → slave frames |
slaveId | 0x201 | CAN id of slave → master frames |
extendedIds | false | 11-bit identifiers |
requestTimeoutMs | 1000 | response timeout of a command |
requestRetries | 2 | repetitions of a command after a timeout (in addition to the first attempt) |
daqTimestamps | slave | time axis of DAQ samples from the board's timestamps |
The daqTimestamps setting has a visible effect on the DAQ packet layout
on CAN: with slave the first ODT of each cycle carries a four-byte
timestamp and has 2 data bytes left; without ECU timestamps (master)
every ODT has 6 data bytes. The four measured floats spread over several
packets per cycle in both cases — the protocol does that by itself, see
DAQ behaviour and diagnostics.
Block mode is not configured — the protocol detects it at connect and
logs it; on CAN the slave reports MAX_BS 16.
Events
Four events; DAQ and STIM point to the same
firmware event channel demo10ms (daqId="0"), only in opposite
directions:
| Event | Type | Extra Params | Used for |
|---|---|---|---|
Daq_demo10ms | Periodic 10 ms | direction="DAQ";daqId="0" | the board transmits the measured signals (the period only documents the channel cycle) |
Stim_demo10ms | Periodic 10 ms | direction="STIM";daqId="0" | the master sends the current value of sine1_stim every 10 ms |
Poll500ms | Periodic 500 ms | — | polling of the calibration parameters, the bypass switch, the uwTick counter, the curve and qfwDemoMapOut |
OnRequest | OnRequest | — | maps read by the Read button |
Scalar variables
All thirteen scalar variables have addressExtension="0" and
multiplier="1" in their Comm params; in the DebugCan build the
addresses are the same as in the FreeRTOS image for TCP:
| Variable | Type | Address | Direction | Event | Presentation |
|---|---|---|---|---|---|
sine1_value | float | 0x2400005C | read | Daq_demo10ms | Sine value (−10…10) |
sine1_raw | float | 0x24000058 | read | Daq_demo10ms | Sine value — internal model of sine 1, keeps running during bypass |
sine2_value | float | 0x24000074 | read | Daq_demo10ms | Sine value |
sine3_value | float | 0x2400008C | read | Daq_demo10ms | Sine value |
sine1_amplitude | float | 0x24000050 | readWrite | Poll500ms | Amplitude (0…10) |
sine1_period | float | 0x24000054 | readWrite | Poll500ms | Period (0.05…60 s; a shorter period is clamped by the firmware) |
sine2_amplitude | float | 0x24000068 | readWrite | Poll500ms | Amplitude |
sine2_period | float | 0x2400006C | readWrite | Poll500ms | Period |
sine3_amplitude | float | 0x24000080 | readWrite | Poll500ms | Amplitude |
sine3_period | float | 0x24000084 | readWrite | Poll500ms | Period |
sine1_stim | float | 0x2400005C | write | Stim_demo10ms | Stim level (0…100 %) |
sine1_bypass | byte | 0x24000060 | readWrite | Poll500ms | Bypass (0/1) |
uwTick | uint | 0x24000124 | read | Poll500ms | HAL tick (ms) — proof that any global variable from the ELF is reachable |
Note the pair sine1_value / sine1_stim: the same address, once
read via DAQ, once written by the STIM stream. Firmware defaults: sine 1
amplitude 1.0 / period 1 s, sine 2 5.0 / 3 s, sine 3 0.5 / 10 s.
There are three conversions: PassThrough (1:1) for everything except
the stimulation and the large map's axis, StimPercent for sine1_stim
— linear multiplier=5, offset=50, i.e. eng = raw · 5 + 50 (the
operator and the script enter percent, QInsight inverts the value to
raw: 75 % = raw 5.0; 50 % = raw 0) — and LoadTenth (×0.1) for the Y
axis of the large map.
Matrix variables
In the DebugCan build the matrix variables have these addresses
(address extension 0, little-endian):
| Variable (Label) | Shape | Size | Address | Direction | Event |
|---|---|---|---|---|---|
qfwDemoMap (Ignition map) | 16 × 16 float map, axes ushort / byte | 1072 B | 0x2401421C | readWrite | OnRequest |
qfwDemoCurve (Torque curve) | 8-point ushort curve | 32 B | 0x2401464C | readWrite | Poll500ms |
qfwDemoBigMap (Injection map 64x64) | 64 × 64 float map, axes ushort | 16,640 B | 0x2401466C | readWrite | OnRequest |
qfwDemoMapOut (Map lookup) | float scalar | 4 B | 0x2401876C | read | Poll500ms |
The presentations of the axes and data and the firmware defaults are the same as in the TCP variant.
Scripts
Two scripts, both runtime-only (not for replay). init.py runs in
Startup mode and prepares the state:
import math
t = 0
a = 4
f = 1/5
script.py runs periodically every 20 ms (blocking, no timeout):
t += 0.02
sine1_stim.EngValue = 50 + a * math.sin(2 * math.pi * f * t)
So the script writes a 50 ± 4 % sine with a period of 5 s into
sine1_stim; after the inverse conversion that is raw ±0.8. Writing
EngValue only stores the value — the STIM stream of the
Stim_demo10ms event carries it to the board every 10 ms, and it takes
effect only while sine1_bypass = 1. The scripts
share one namespace, so t, a
and f from init.py are available in script.py; a and f can be
changed at runtime in the Python Interpreter window.
Workspace
The workspace has four controls:
- Graph (15 s window):
sine1_value(red),sine1_raw(orange),sine2_value(blue) andsine3_value(green). - Watch Table (250 ms refresh)
with all scalar variables except
sine1_rawand with the Write column — this is where you calibrate, toggle the bypass and enter a manual stimulation. - XY Graph:
sine1_valueon the X axis againstsine3_value, persistence 22 s. - Matrix with three tabs: the
qfwDemoMapmap (Read button, colour scale 4–32.5), theqfwDemoCurvecurve (polled) and the large mapqfwDemoBigMap(Read button).
The layout also opens both scripts and the Python Interpreter window next to the workspace.
CAN specifics
- A classic CAN frame carries at most 7 data bytes of a response, so the 1072 B map means more than 150 frames and the 64 × 64 map more than 2,300 frames. Reading the 16 KB map at 500 kbit/s takes approximately 0.6 s — which is why both maps are on the On Request event and are not polled.
- Reads use slave block mode (
UPLOADbursts), writes use master block mode in blocks of 16 × 6 B (DOWNLOAD+DOWNLOAD_NEXT, one acknowledgement per block). - The curve (32 B) is polled every 500 ms on CAN too.
- A matrix transfer spread over several frames is not atomic — if the firmware is changing cells meanwhile, the block read may mix old and new values.
What you will see and what to try
- Measurement. After Connect the XCP session is established, the
log shows the name and cycle of the board's event channel and the
graph starts drawing four sines;
sine1_valueandsine1_rawoverlap,uwTickin the table grows every 500 ms, the torque curve fills. - Maps. Press Read on the ignition map tab — on CAN you can
watch the block load. Edit cells in Write Mode, press Write and
check with another Read and the
Map lookupvalue. Load the large map on its tab; the read takes approximately 0.6 s. - Bypass. Write
sine1_bypass = 1.sine1_valuedetaches from the model and starts following the slow sine from the script (raw ±0.8), whilesine1_rawkeeps showing the internal model. The shape on the XY graph changes. Write0andsine1_valuereturns to the model. - Manual stimulation. Set
a = 0in the Python Interpreter (or disable the script in the project) and enter e.g.75intosine1_stim— a constant raw value of 5.0 is transferred to the board until you overwrite it. - Calibration. Write
sine2_amplitude = 8orsine3_period = 2— the write goes throughSET_MTA+DOWNLOADin engineering units (Writing values to the device) and the new value comes back by polling within 500 ms. - Unplugging the adapter. Unplug the PCAN-USB while running. Within
one second the driver reports the transport loss to the protocol, goes
Faulted, tries to reopen the adapter twice (with a 1 s delay) and
then stops its protocol with the error
gave up after 2 reconnect attempt(s)and ends up Stopped. The runtime keeps running — the script keeps computing, but no data is transferred. Plug the adapter back in and press Start in the driver's Properties window: the driver and the protocol start, XCP establishes a new session and DAQ and STIM resume, see Driver states and the Start button. If you plug the adapter back in during the two attempts, the connection recovers by itself.
Related chapters
- XCP on TCP on a NUCLEO-H723ZG — the detailed description of the variables, presentations, scripts and the workspace.
- Reference — PEAK CAN Adapter and Reconnection.
- Reference — XCP on CAN, XCP polling, DAQ, and STIM, Matrix variables over XCP and Block mode.
- Events — Extra Params for DAQ and STIM.
- Start and stop — driver states.
- Matrix control.
- XCP in the QFW SDK and XCP on classic CAN — the example firmware, the CAN transport.
- Scripts overview — the Startup and Periodic modes.