
The QInsight user interface
QInsight is a graphical application with a main ribbon menu and a dockable panel showing the individual details of the project.
Ribbon menu
Not all ribbon buttons are available at all times — their availability follows the current state of the application. A disabled (greyed-out) button is not an error: the application is simply not in a state where the action makes sense. Three states matter:
- No project is open — creating and opening a project, the tools, and the application settings are available.
- A project is open (edit mode) — managing and configuring the project and preparing a measurement are available.
- A measurement or a log replay is running — most of the ribbon is locked so that the project configuration cannot change while running; the stop buttons (Disconnect, Stop) and the tools remain available.
Each tab below states when its buttons are available.
Home


Project management and access to its configuration:
- Project — create, open, save, password-protect, and close a project (New, Open, Save, Save as, Password, Close). The Password button sets, changes, or removes the project password — see the Project password chapter.
- Workspace — add and remove a workspace (Add, Remove).
- Project Configuration — configure the individual parts of the project: Project, Drivers, Protocols, Events, Variables, Presentations, Conversions, Scripts.
Availability: New and Open are available whenever no measurement or replay is running. The other buttons (Save, Save as, Password, Close, the Workspace group, and the whole Project Configuration group) additionally require an open project. While a measurement or replay is running, the whole Home tab is unavailable.
Runtime


Running the communication and working with recorded data:
- Run — connect to and disconnect from the device (Connect, Disconnect).
- Replay data — import a recorded log, export it, and play it back (Import, Export, Replay, Stop, Pause), including the record timeline.
Availability: the whole Runtime tab requires an open project.
- Connect is available only when no measurement or replay is running; Disconnect, conversely, only while a measurement is running.
- Import and Export are available only outside a measurement or replay; Export additionally requires an imported log.
- Stop loading is available only while an imported log is being loaded.
- Replay requires an imported log; Stop and Pause/Resume are available only while a replay is running.
- The timeline (the position box and the slider) is active only during a replay that is paused (Pause) with the log fully loaded.
Tools
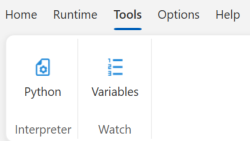
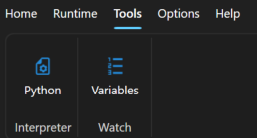
Additional tools:
- Interpreter — the integrated Python interpreter.
- Watch — an overview of all variables (Variables), including their current state and value.
Availability: both buttons are always available — with no project open as well as during a measurement or replay.
Options
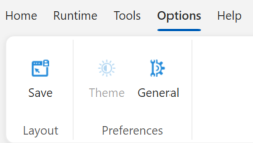
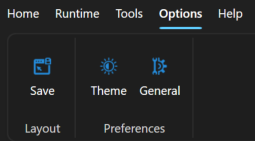
Application settings:
- Layout — save the window layout for both the edit and runtime mode (Save).
- Preferences — application appearance (Theme) and general settings (General).
Availability: Save (Layout) is always available. General is available only when no measurement or replay is running.
Important: The Theme button is available only when no project is open. If it is greyed out, close the project first (Home/Project/Close), change the appearance, and reopen the project.
Help


Information about the application and quick access to the online documentation — the buttons in the Getting Started, User Guide, and Advanced groups open the corresponding chapter of this site in your browser.
- Info — information about the application and the license:
- License — license overview: status, tier, subscription validity, and
the current number of communicated signals. This is also where you
activate the license by entering a license key (format
QNX-XXXX-XXXX-XXXX-XXXX, from your account at account.qenex.net). The license comparison and offline behavior are described in Licensing. - About — the application version and vendor information (QENEX s.r.o.).
- License — license overview: status, tier, subscription validity, and
the current number of communicated signals. This is also where you
activate the license by entering a license key (format
- Getting Started — an introduction to the application:
- Getting Started — what QENEX Suite and QInsight are.
- First Project — creating and saving your first project.
- Connecting a Device — connecting a device (drivers and protocols).
- User Guide — the main topics of working with the application:
- Variables — variables, presentations, and conversions.
- Visualization — workspaces and display elements (controls).
- Running — starting and stopping the communication.
- Logging & Replay — logging data and playing it back.
- Python Scripts — scripting in Python.
- Advanced — advanced topics:
- Custom Extensions — developing your own drivers and protocols.
- Reference — a reference overview of the bundled drivers, protocols, and controls.
- Examples — complete example projects.
Availability: all buttons on the Help tab are always available.
Dockable project panel
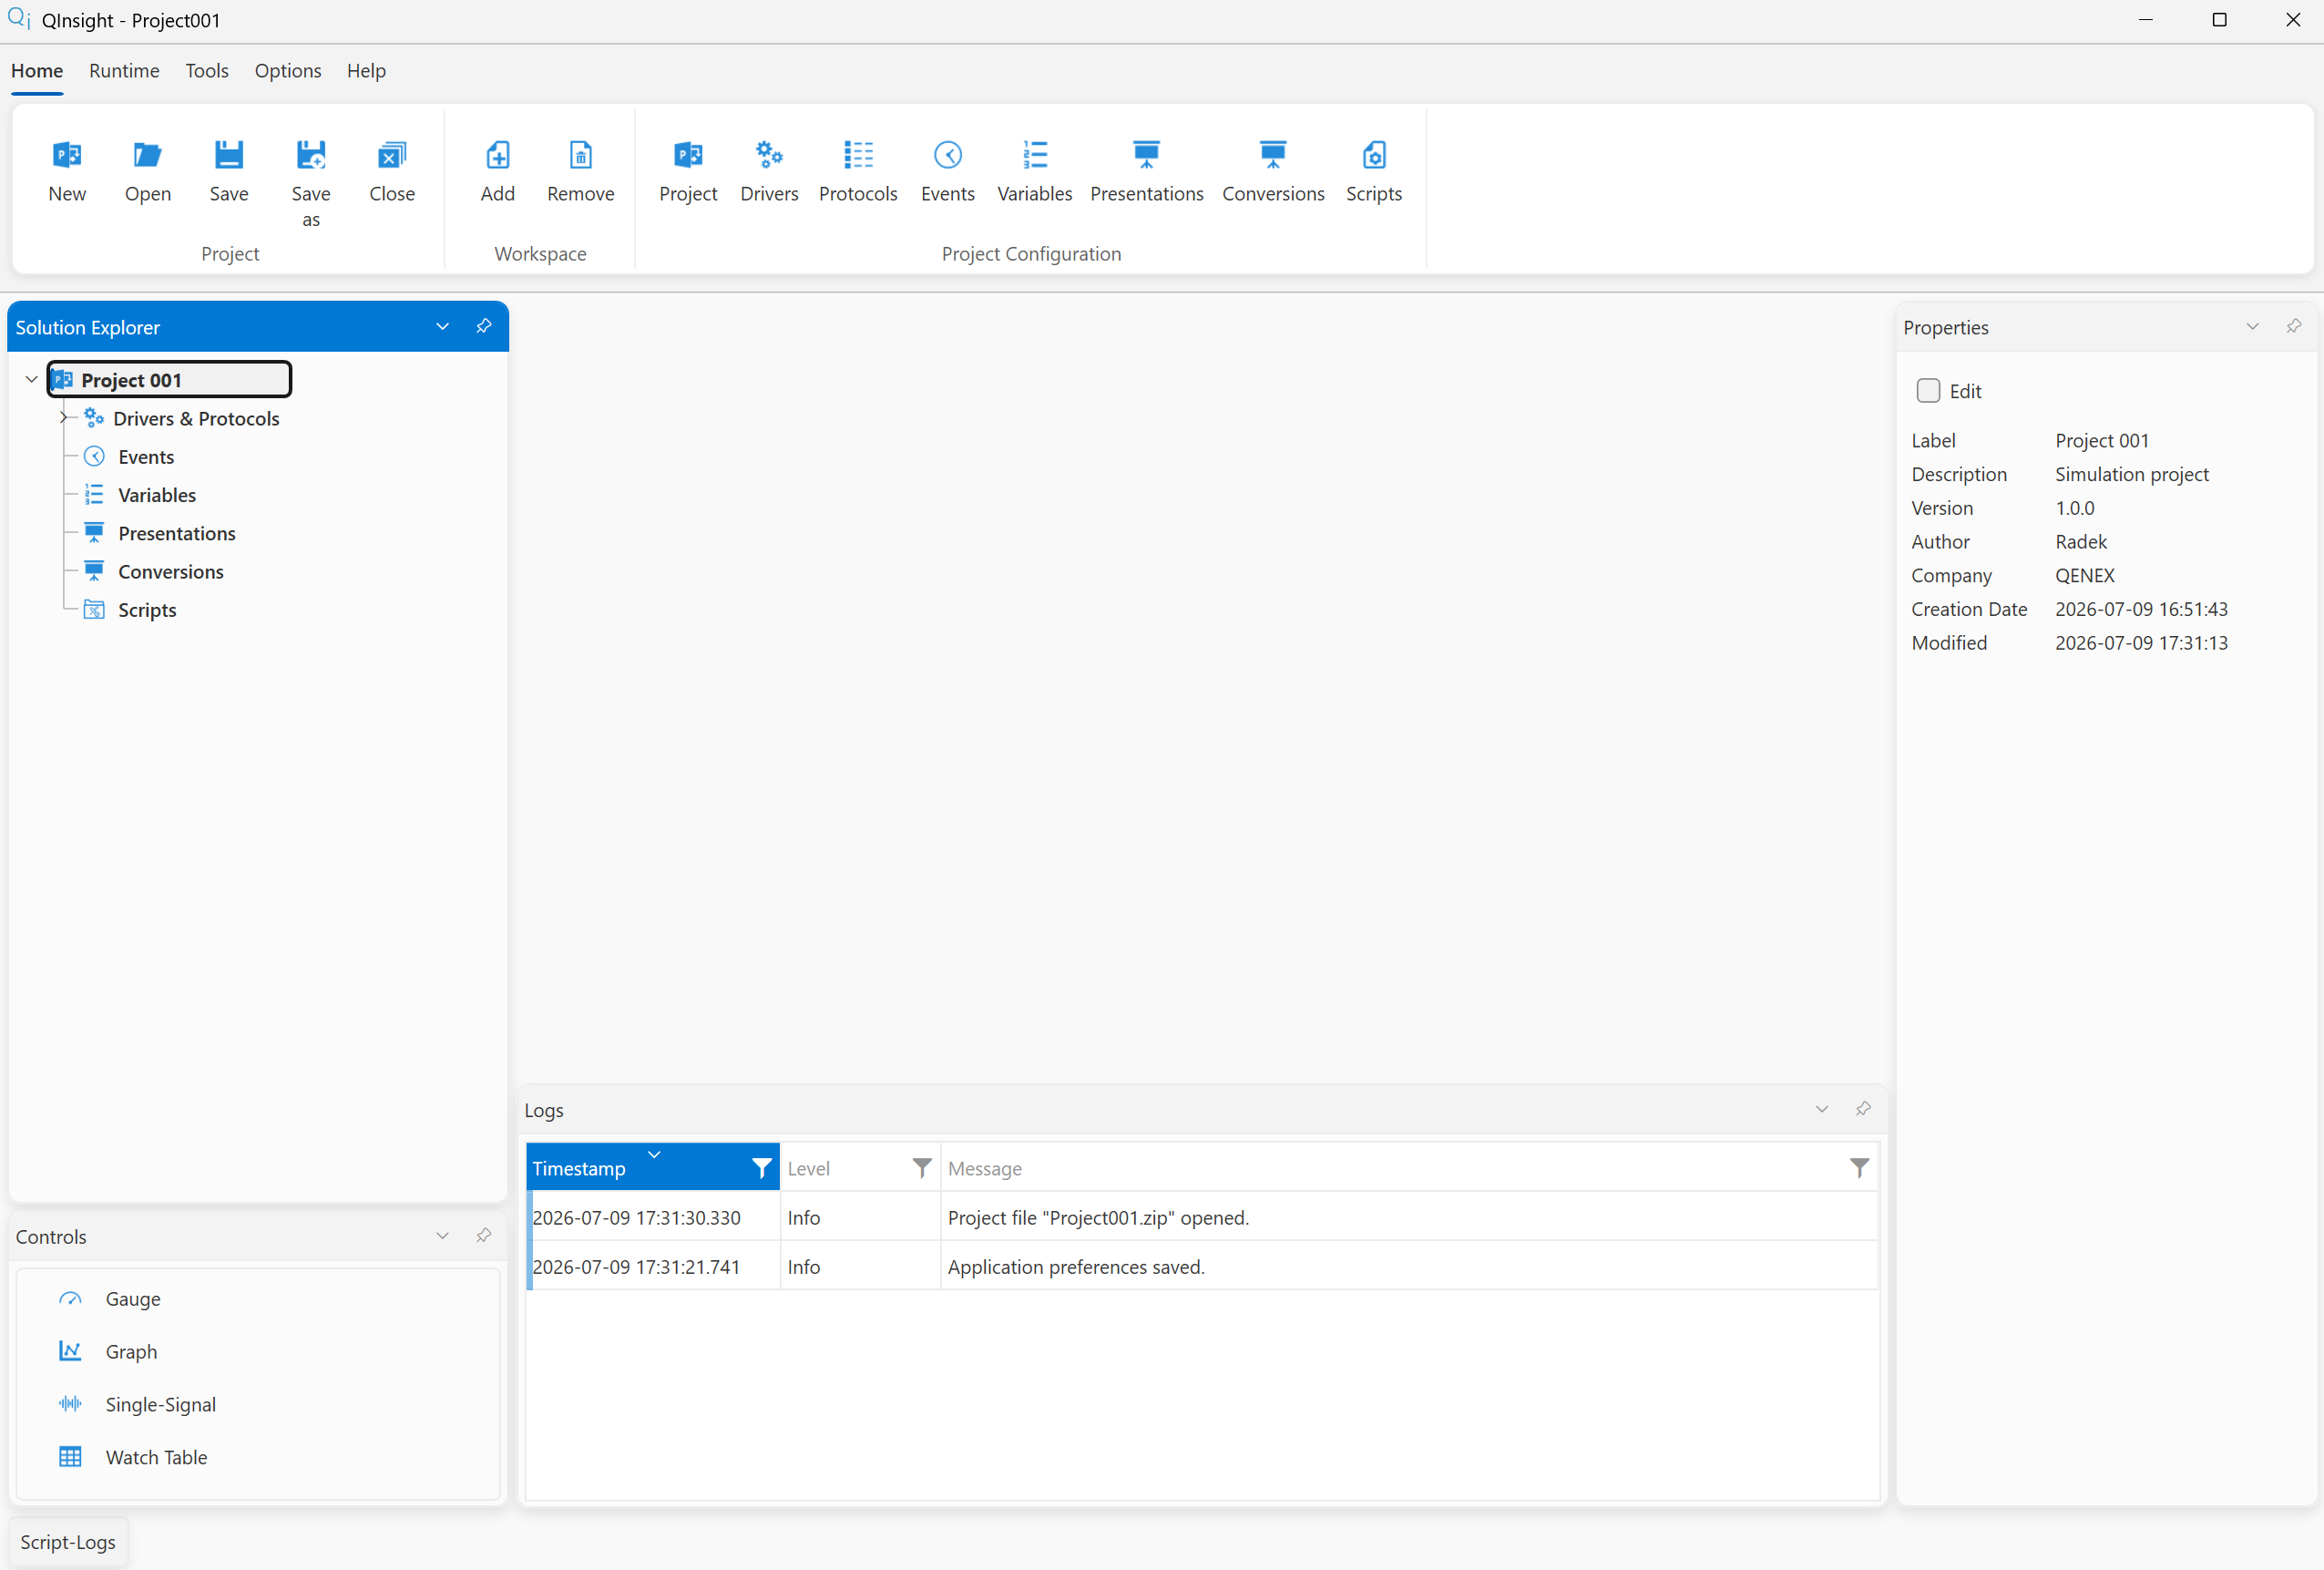

The project itself is shown in a dockable panel that lets you arrange the basic windows that are not part of the project. These are Solution Explorer, Controls, Logs, Script-Logs, and Properties. This arrangement can be saved separately for the edit and runtime mode (in the given mode, click the Save button in the Options/Layout menu); the arrangement is then kept across all projects. The layout of the project's own windows (the workspaces) is stored separately in the given project — it is saved automatically when the project is saved (Home/Project/Save or Save as).
The Solution Explorer shows the individual parts of the project. Clicking an item shows its properties on the right in the Properties window. Controls are display elements for the values of communicated variables; they are placed onto a workspace by drag & drop. The Logs window shows information about the application state (e.g. a warning from a Python script). Script-Logs shows messages from running Python scripts (the standard output is redirected into the log window — e.g. anything printed with print).
Opening a project
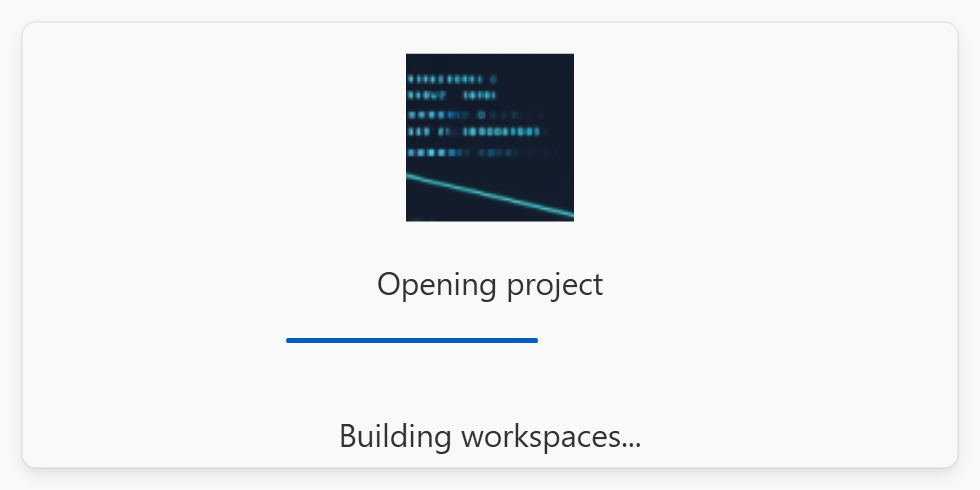
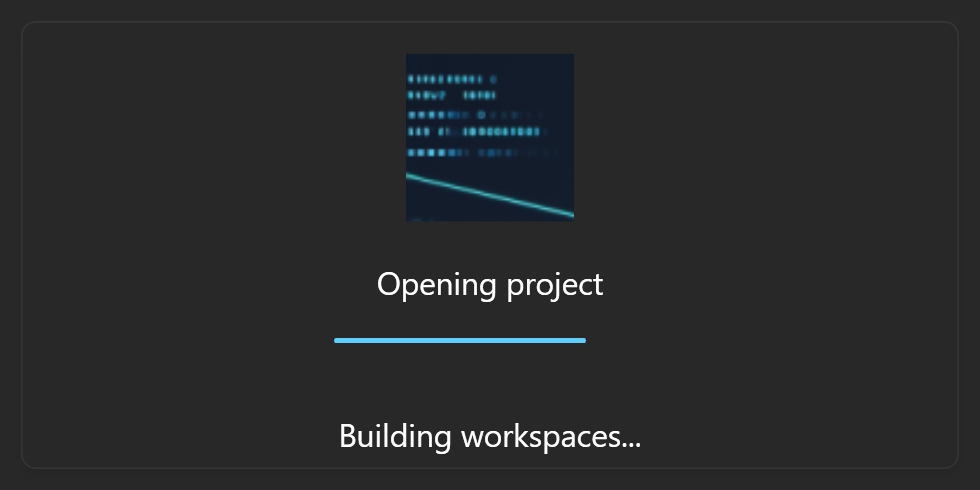
While a project opens (Open or a .qproj file passed on the
command line) a splash window is shown over the main
window with the logo, the caption Opening project, a progress bar,
and the current step (e.g. Building workspaces...). It stays up for
at least 0.8 s and disappears once the workspaces are ready — so the
workspaces do not flicker while loading.