Graph — signal time course
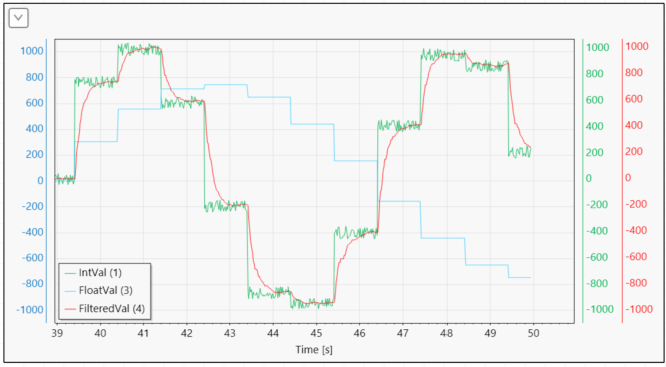
The Graph draws the time course of one or more signals. Every variable dropped on the control adds another data series; it accepts numeric scalar variables.

Settings
The control's expandable section has three tabs:
- General — Hor. legend (a horizontal legend), Cursor (a cursor for reading values), Title (the chart title), Buffer ms (the data buffer size), and Time span s (the width of the time window).
- Signals — a table of the bound series: Label, Visibility, Color (line color), Width (line width 1–20), Style (line style — Solid, Dashed, DenselyDashed, Dotted; handy for telling series apart in black-and-white prints), and Axis Id — a combo box assigning the series to a chosen vertical axis. The Remove button removes the series.
- Axes — management of the vertical axes (Add/Remove): each axis has an Id, Side (left/right placement), Label (an axis caption — drawn vertically along the axis in the same color as the axis; an empty caption takes no space in the chart), Visibility, Color (an optional axis color, otherwise the theme color), and a range — AutoScale or a fixed Min/Max.
Multiple axes are useful for signals with different ranges (e.g. speed and temperature in one chart) — each axis can sit on a different side and have its own color.
Context menu
- Clear Graph — clears the drawn data,
- Zoom to Fit — resets the zoom to the whole time window,
- Export Image — saves a snapshot of the chart (PNG, SVG…),
- Export CSV — saves the series data to CSV,
- Lock — locks the control on the workspace.
Next
The relationship of two signals (hysteresis, Lissajous) is drawn by the XY Graph.