

Matrix control — maps and calibration
The Matrix control displays Matrix variables as tables — each variable gets its own tab. Depending on which axes the variable defines in its Layout, the tab automatically picks one of three display shapes:
- Array (no axes) — a single row of data values,
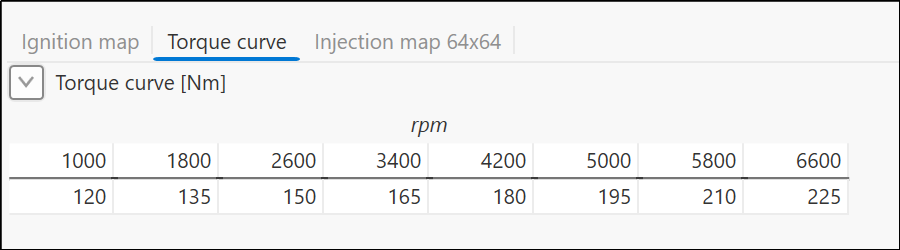
- Curve (X axis + data) — a row of X-axis breakpoints with a row of data values below it,
- Map / matrix (X + Y axes + data) — the X-axis breakpoints as the column header, the Y-axis breakpoints as the row header, and the data cells between them.
So the shape is not set on the control — it is determined by the
Layout of the bound variable (the presence of xCount/yCount, see
Matrix variable).
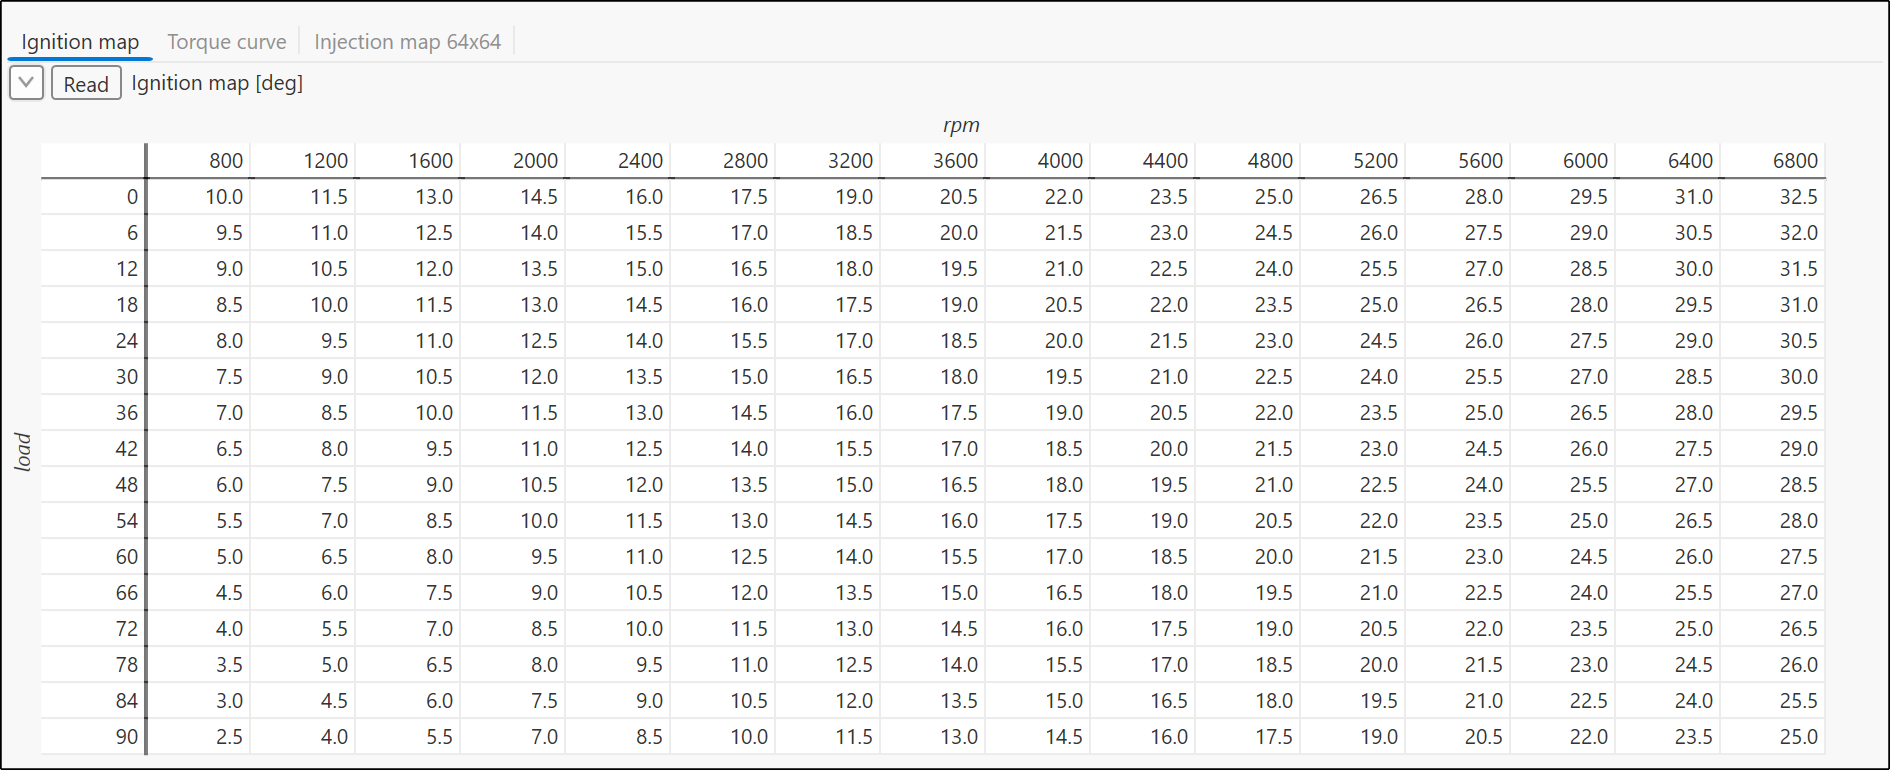
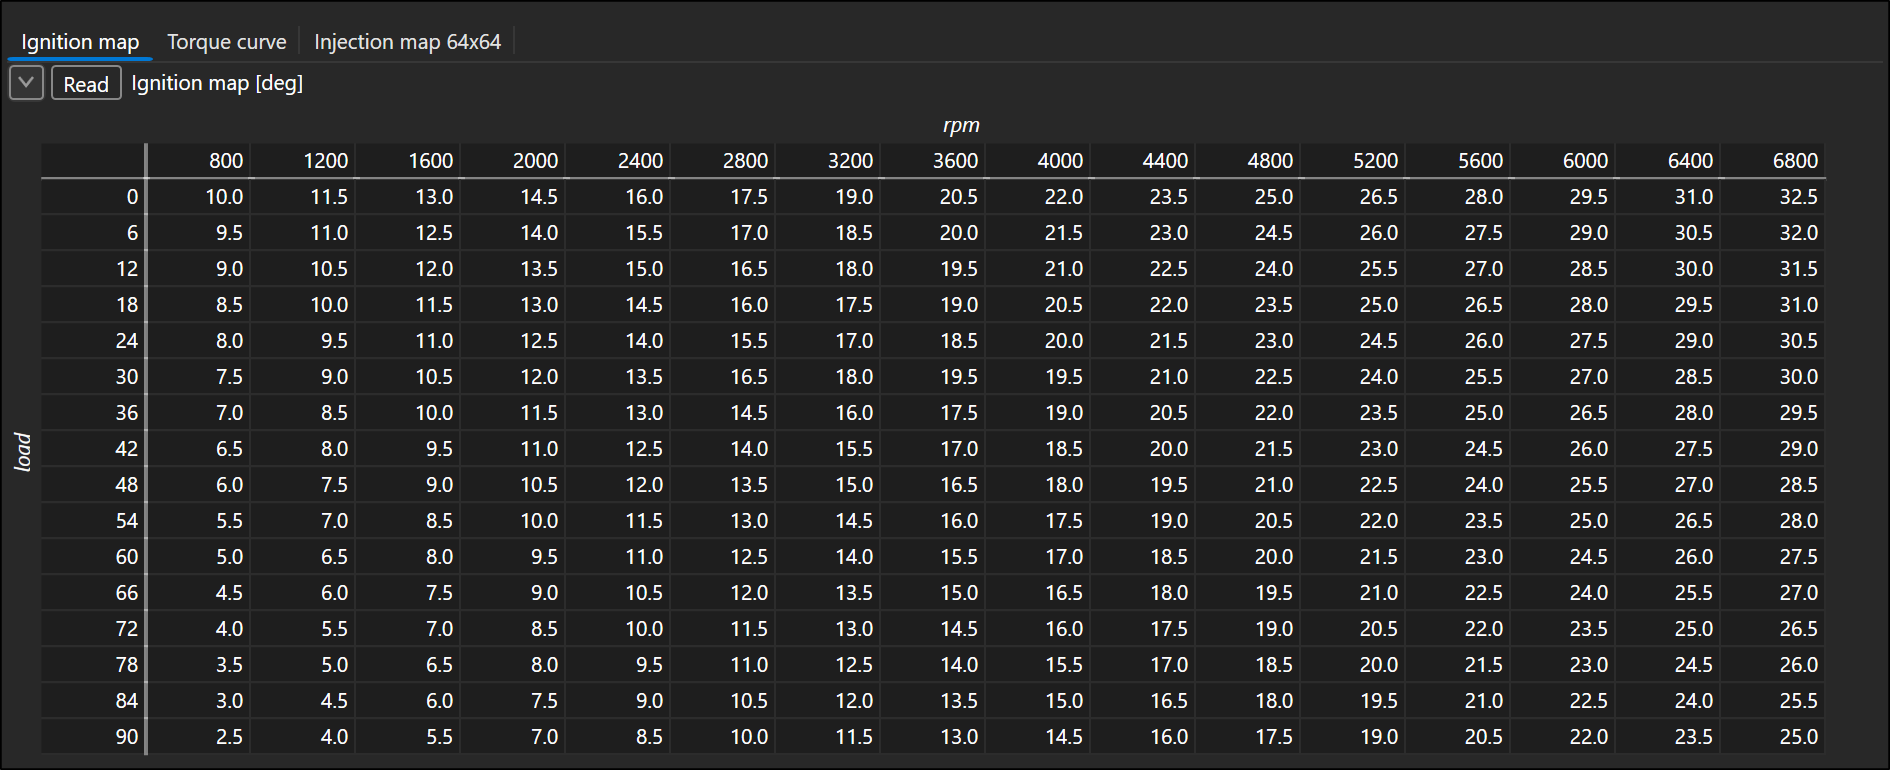
The screenshot shows the Ignition map (16 × 16 float values, X axis
engine speed rpm, Y axis load) from the
XCP on TCP — Nucleo H723 calibration maps
example.
- The tab header shows the variable Label and the unit of the data
presentation (
Ignition map [deg]). - The axis captions from the Layout (
xLabel,yLabel) are drawn in italics above the table (X) and vertically on the left (Y). A 2 px line in the theme text colour separates the axes from the data — the same look as the plot frame of the Graph control. - Each cell is formatted by the presentation of its section (conversion, Print Format) — axes and data can use different units and formats.
A curve has just the X-axis row with the data below it:

Tabs — several variables in one control
- Only a Matrix variable can be bound to the control (drag & drop from the Solution Explorer) — scalar variables are refused, and a matrix cannot be dropped on the other controls.
- Every further matrix you drop adds a new tab at the end; it does not replace the existing one. Dropping a variable that is already in the control does nothing.
- An empty control shows the text Drop a matrix variable (map, curve, value block) here.
- The tab header context menu: Move left, Move right (tab order) and Remove (removes the tab and unbinds the variable).
- A tab with edited cells not yet written shows a bold
*after its name (tooltip Edited cells not written to the device yet). - The empty part of the tab strip belongs to the control — use it to drag the control (in edit mode) and to open the control's context menu.
- Each tab has its own settings and its own write mode; the selected tab and the settings are saved with the project.
Reading
The cells stay empty until data arrives from the device — after binding the variable, after opening the project, after a change of the variable configuration and after every Edit → Run switch. The table shape and the axis captions remain.
How the table is filled depends on the event (Events) assigned to the variable:
- Periodic event — the table follows the device; every poll updates it, with redrawing throttled by Refresh ms.
- On Request event — the variable is not polled. The tab header has a Read button that reads the matrix from the device once (tooltip Read the matrix from the device once (On Request event; discards pending edits)). The button is disabled while a read is in progress; a failed read turns the button and the cells red. Reading works only while the communication runs — in edit mode the read fails.
Periodic variables have no Read button. The former Auto Read option no longer exists — the table always shows what came from the device.
Settings and colour scale (heat map)
The arrow on the left of the header expands the settings of the current tab:
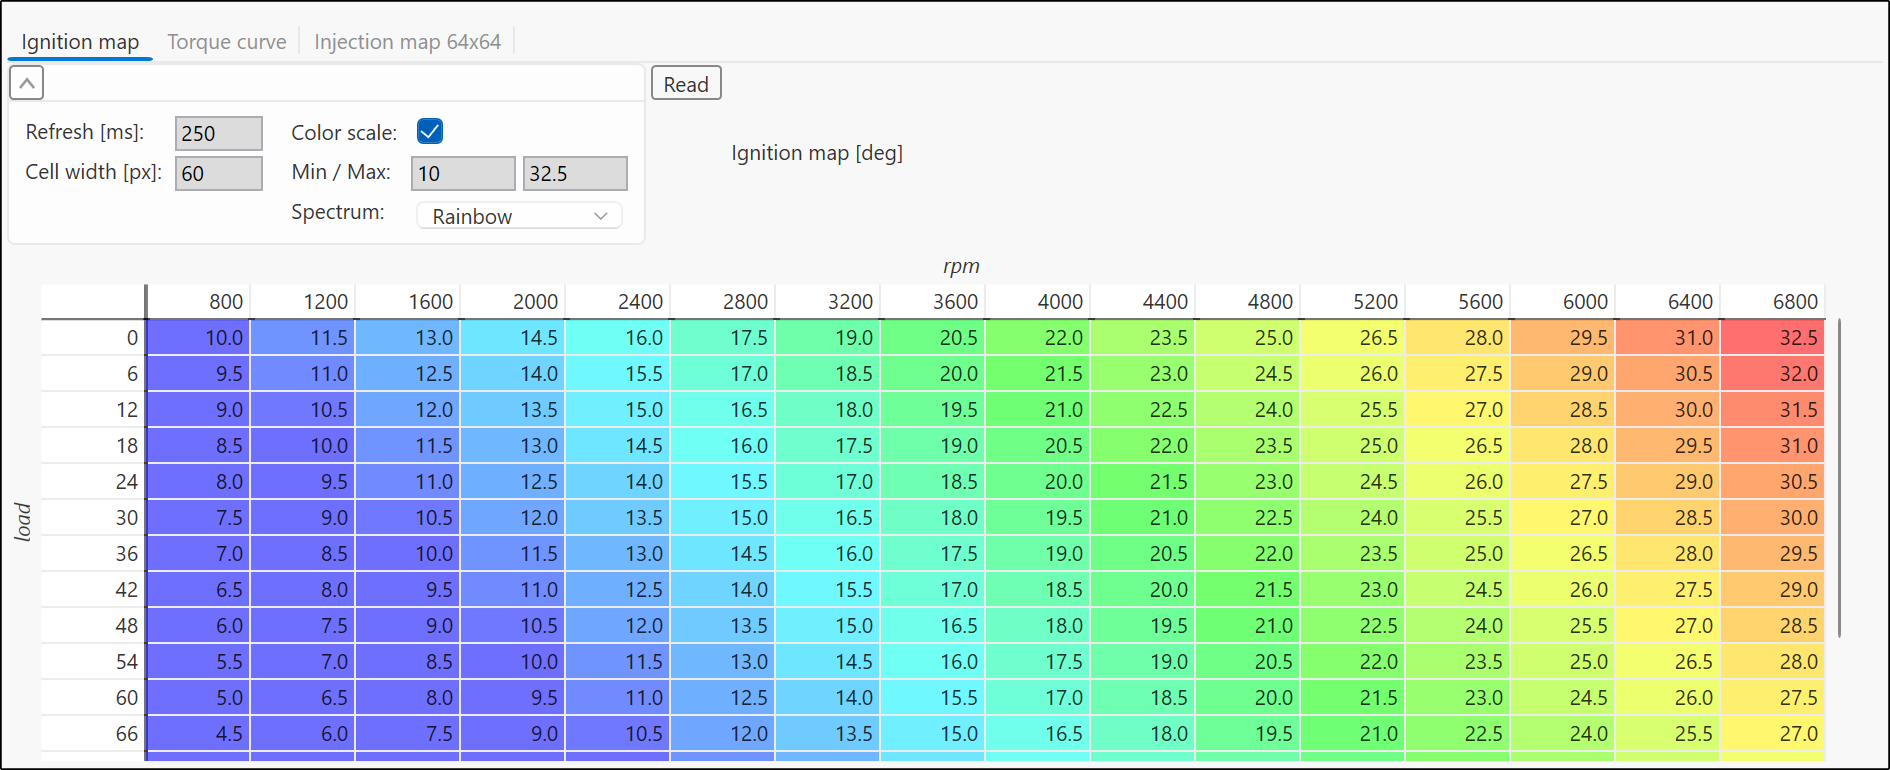
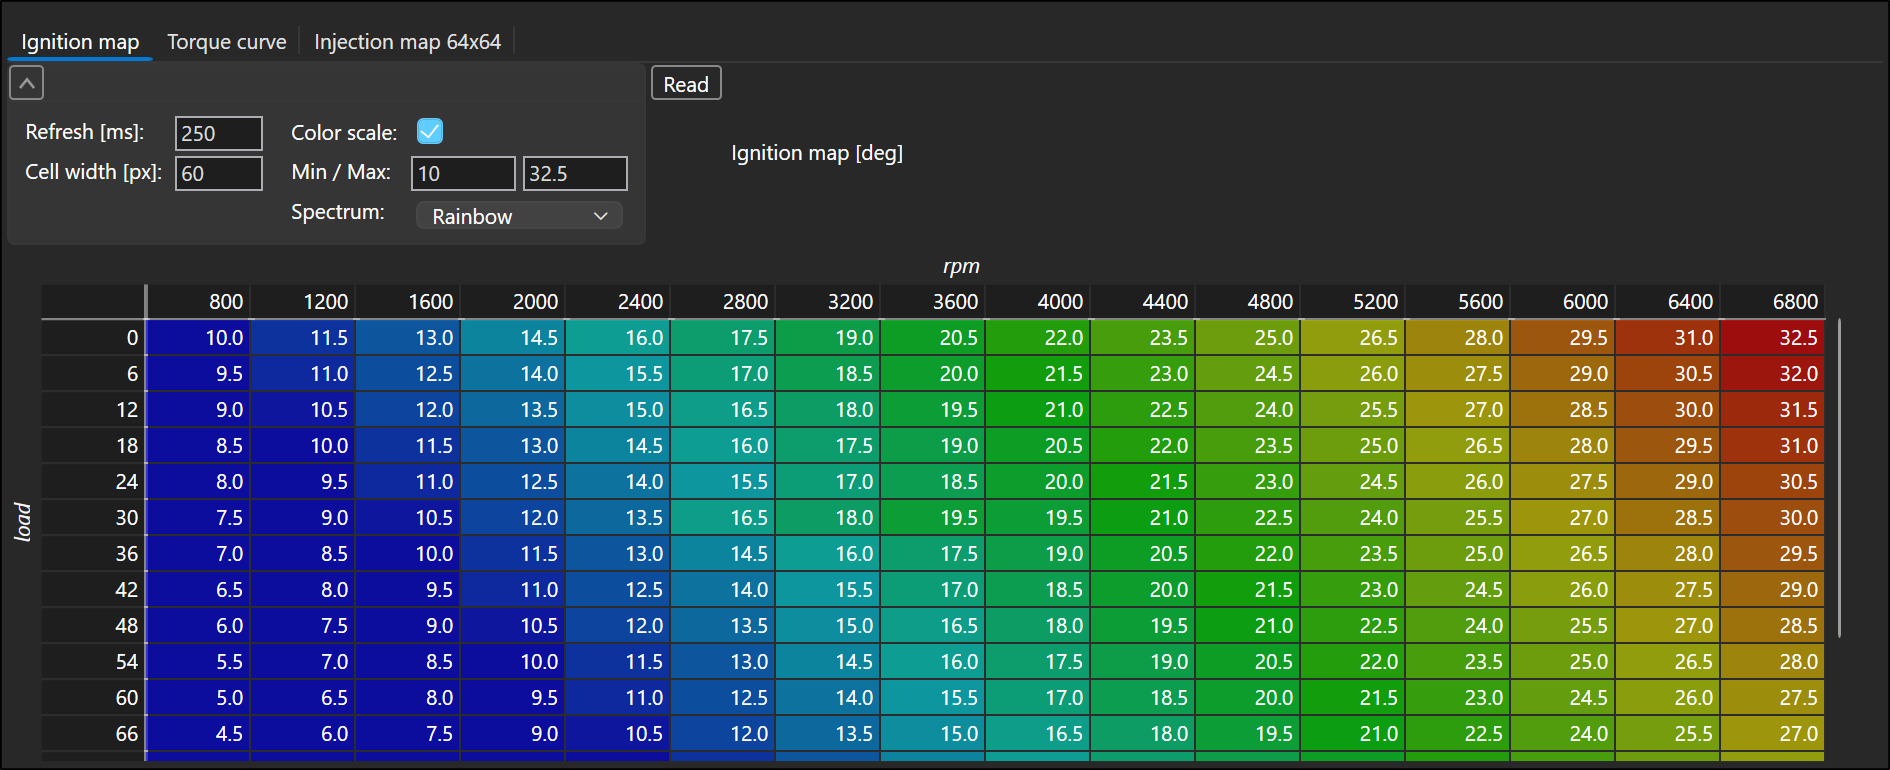
| Setting | Default | Meaning |
|---|---|---|
| Refresh ms | 250 | shortest interval between table redraws |
| Cell width px | 60 | width of all columns (min. 20) |
| Color scale | off | tints the data cells by value |
| Min / Max | 0 / 100 | range of the colour scale (engineering values) |
| Spectrum | Rainbow | palette: Rainbow, BlueRed, GreenYellowRed, Viridis, Grayscale |
Min / Max and Spectrum are enabled only while the scale is on. The row height is fixed (20 px).
With Color scale on, the table becomes a heat map:
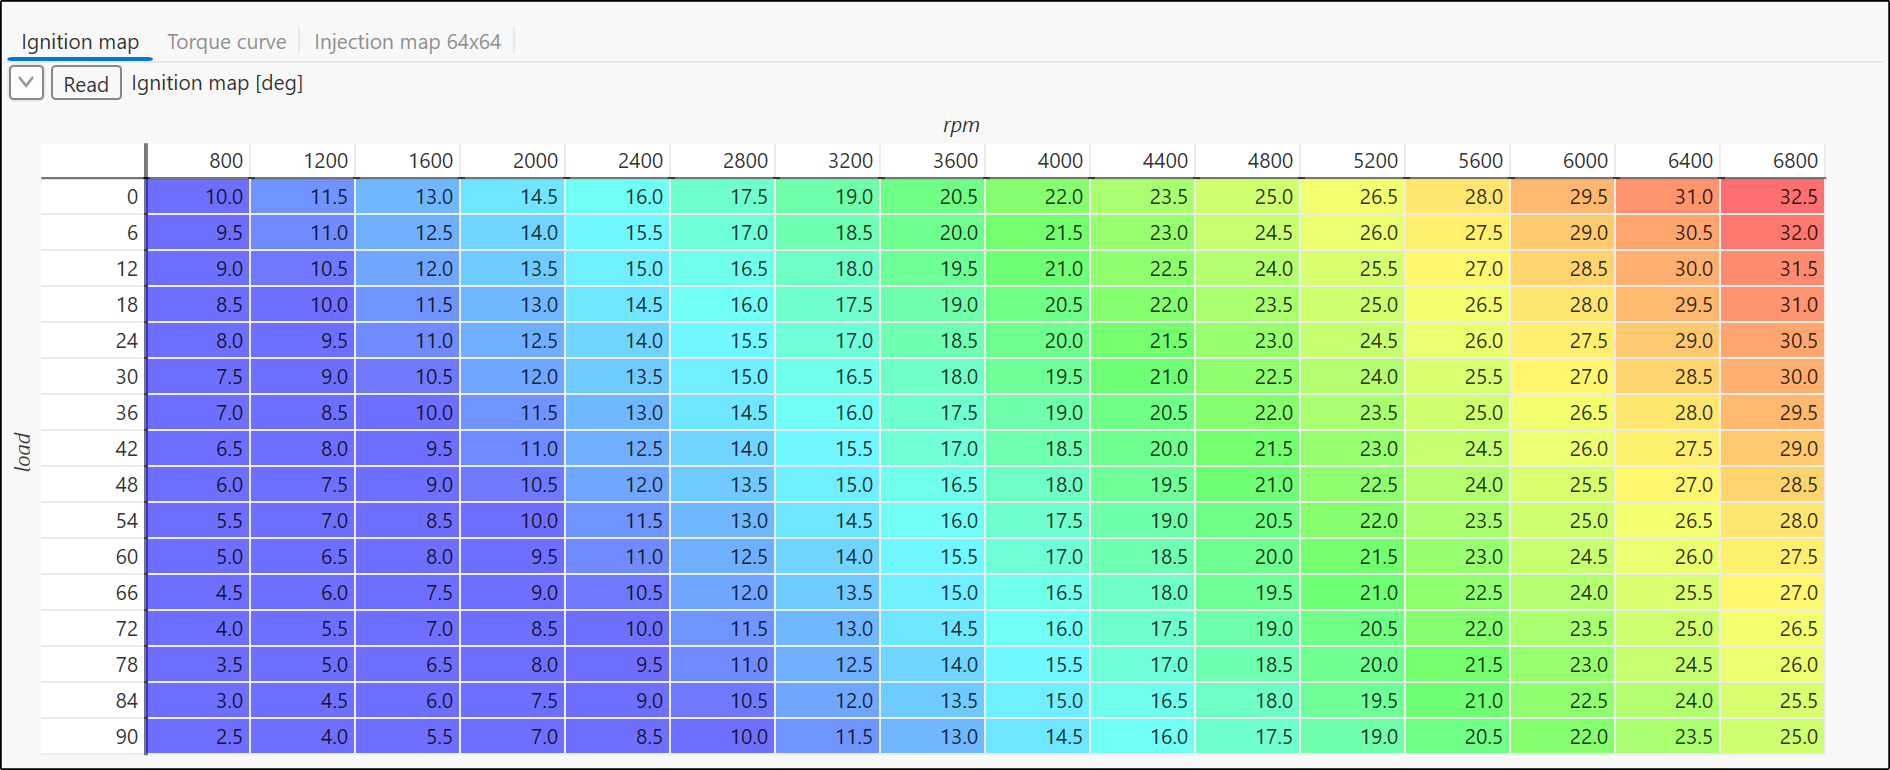
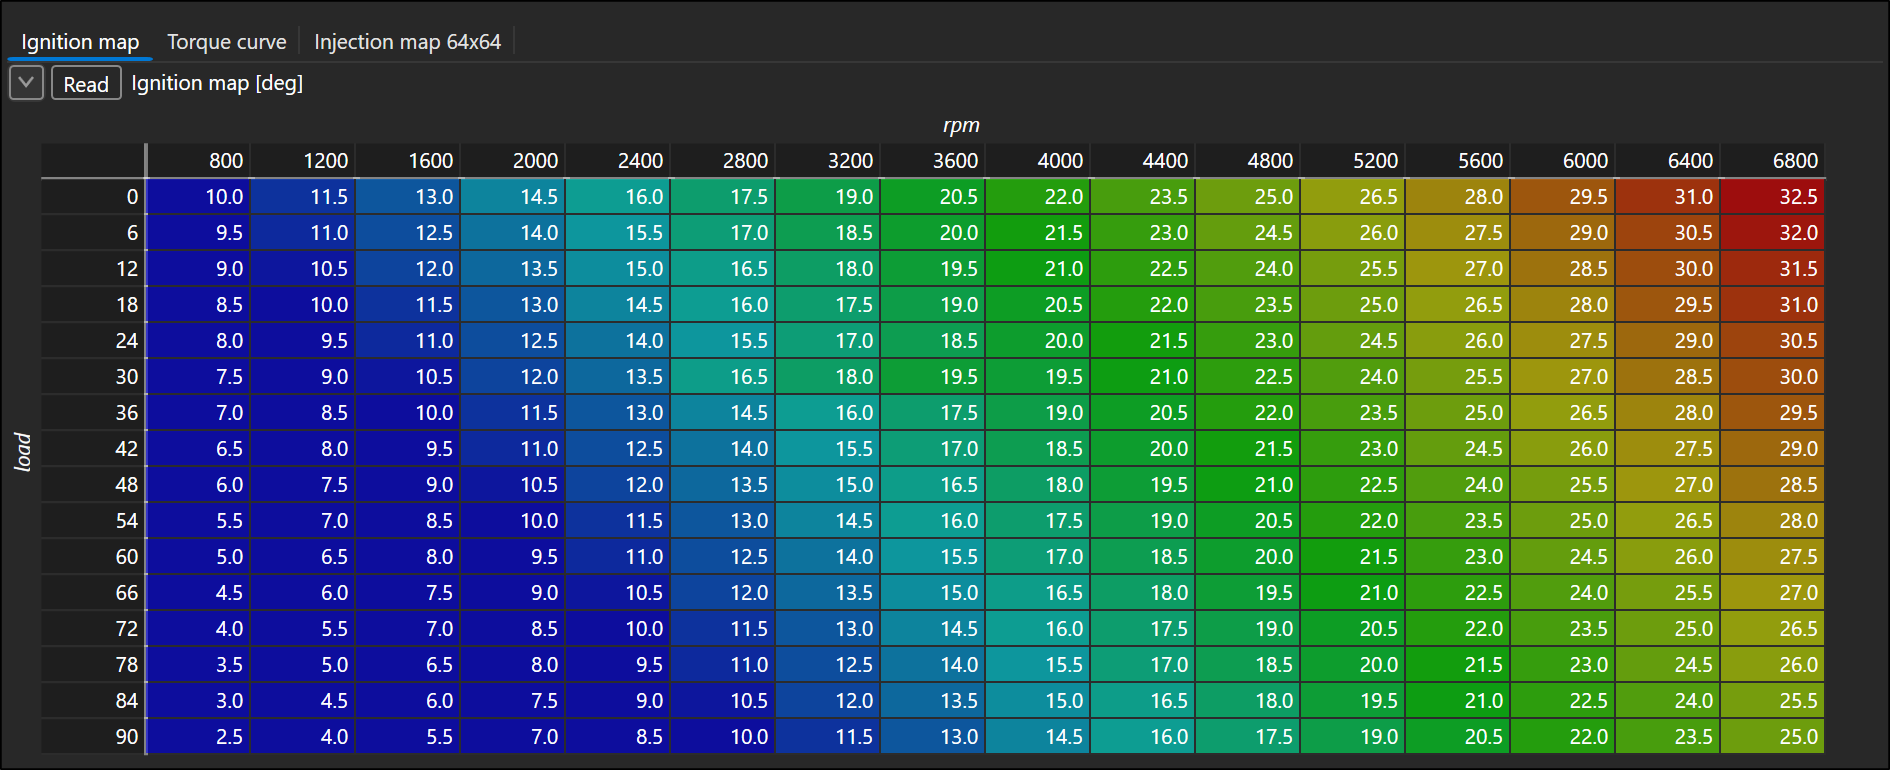
- Only the data cells are tinted — the axes and the corner stay plain.
- Values outside Min/Max are clamped to the end colour; with Max ≤ Min the middle colour is used. A cell without data is not tinted.
- The colours are semi-transparent and quantised to 64 steps.
- In write mode the scale is hidden — the editing colours take precedence (see below).
Large maps
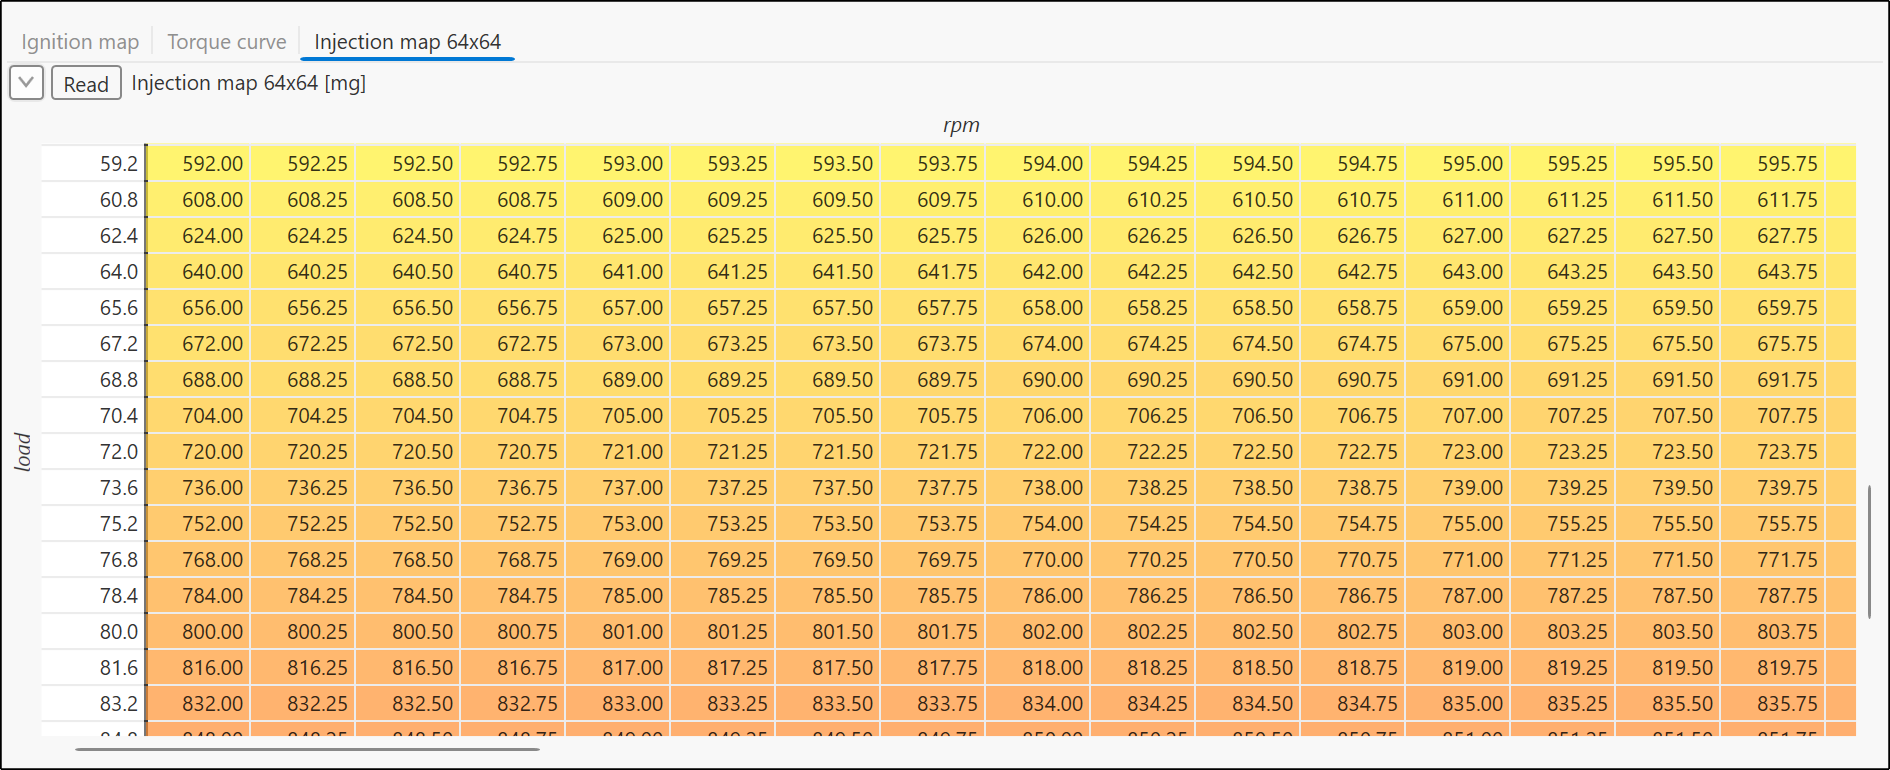
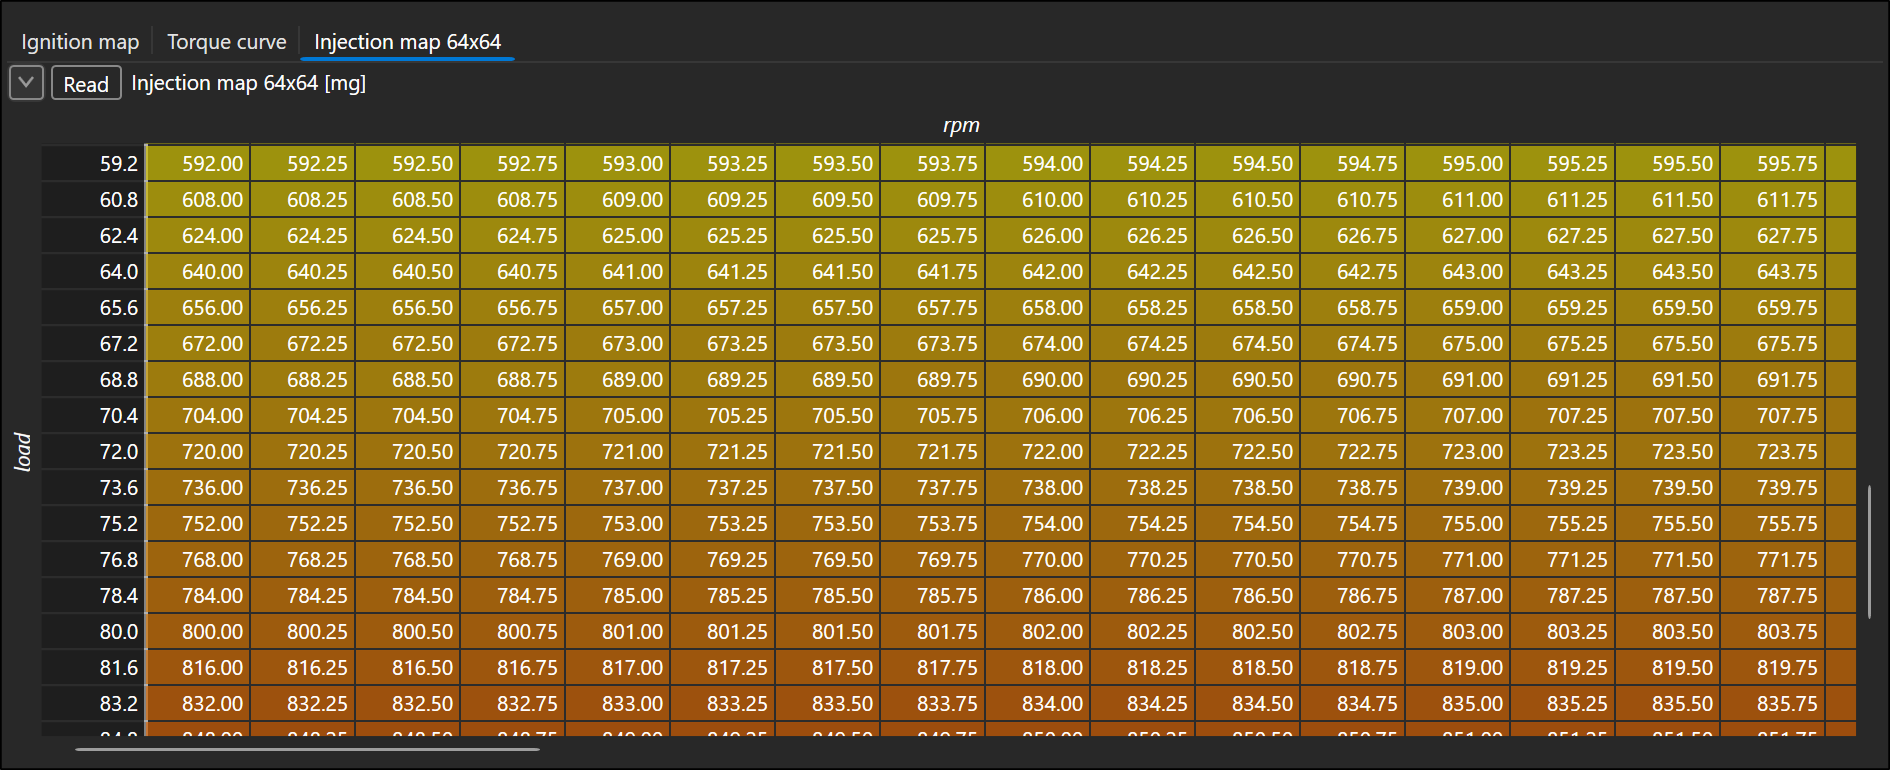
The table is virtualised (only the visible cells are rendered), so it handles even a 64 × 64 map (4,224 cells) smoothly. When the table is larger than the control, scroll bars appear: the Y-axis column stays frozen while scrolling horizontally, the X-axis row scrolls away with the data when scrolling vertically.
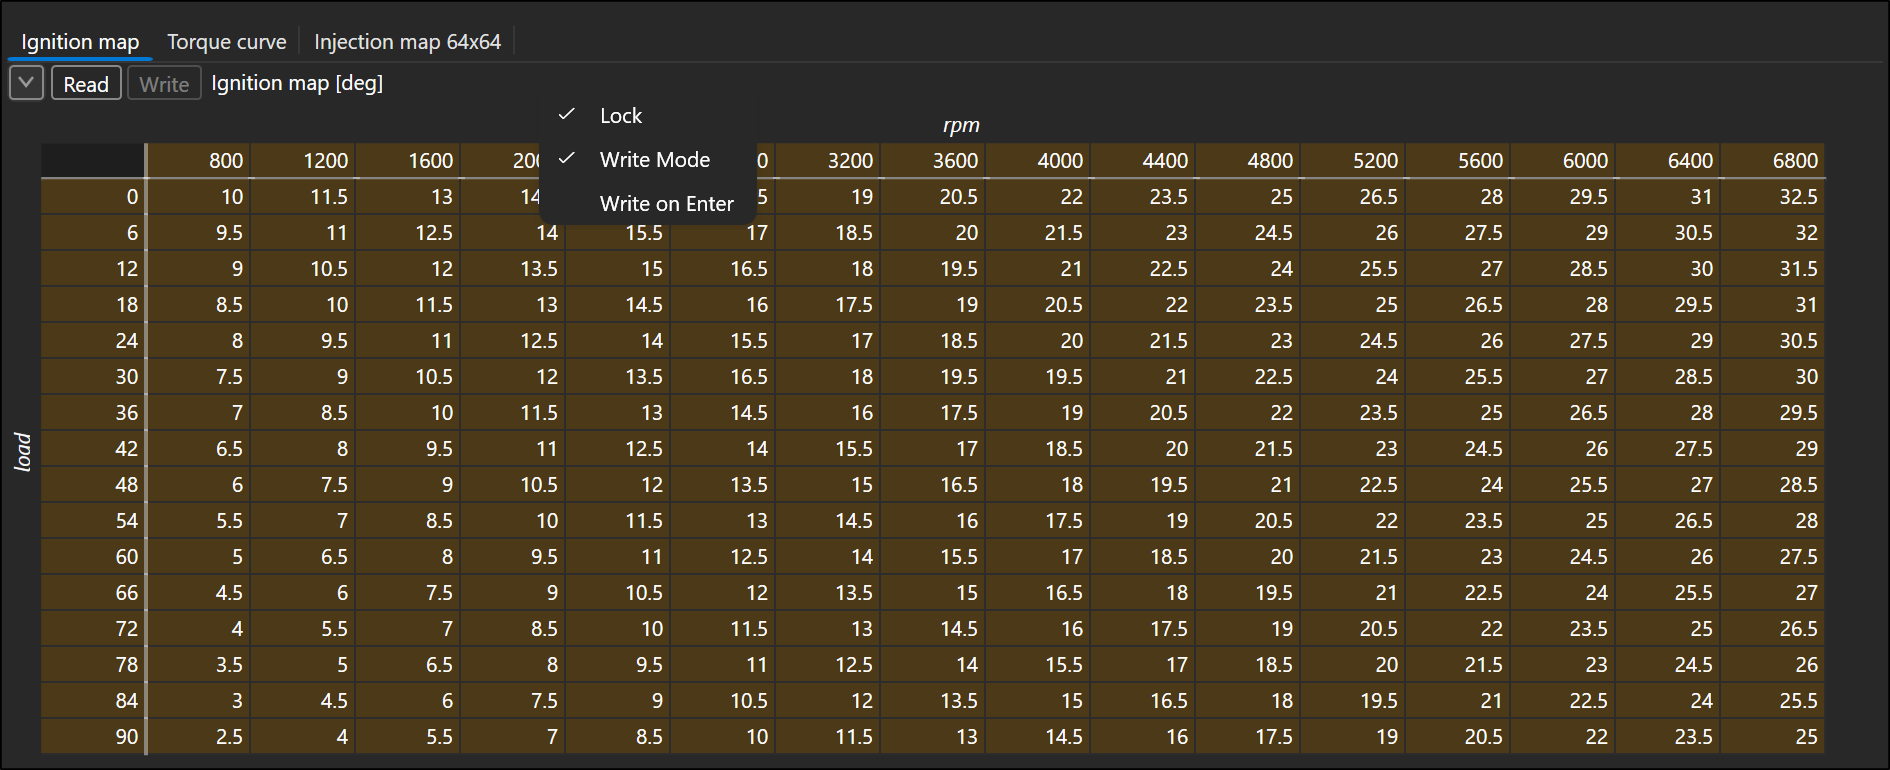
Control context menu
- Lock — locks the position and size of the control,
- Write Mode — write mode of the selected tab; enabled only when
the protocol can write the variable (Comm params with
direction="write"or"readWrite"), - Write on Enter — applies to the whole control (off by default); enabled only in write mode.

Write mode — calibrating cells
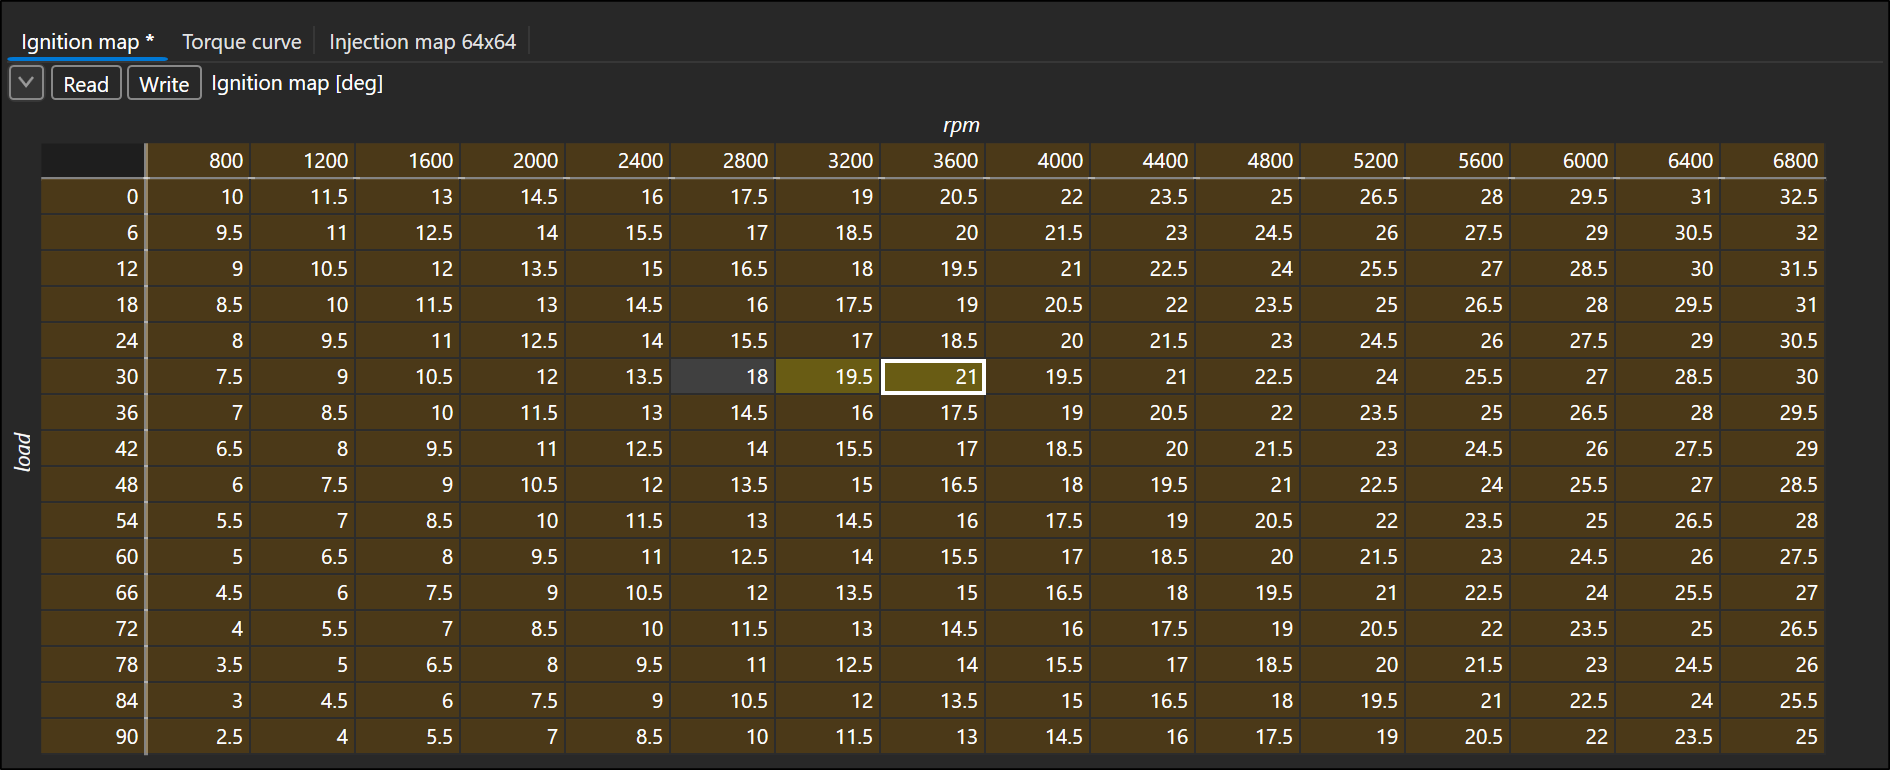
With Write Mode on, the cells get an orange tint and become editable:
- Both data cells and the breakpoints of both axes are editable; the table corner is not. You always enter the engineering value — the raw value sent to the device is obtained by the inverse conversion.
- An edited cell turns yellow, the tab gets the asterisk and the Write button becomes enabled. A cell whose write failed is red.
- The display is frozen in write mode — polls do not overwrite the table while the communication keeps running in the background.

Sending to the device
- Write on Enter on — Enter writes the edited cell immediately; the Write button is not shown.
- Write on Enter off (default) — Enter only commits the cell and the
edits accumulate. The Write button (tooltip Write all edited
(highlighted) cells to the device) sends all edited cells in one
batch:
- with XCP, neighbouring cells are merged into contiguous windows and each window is written in one transfer (a pasted row of 64 cells = one transfer),
- with Modbus, only the registers touched by the cells are written.
- A cell whose text is not a number turns red and is left out of the batch.
- If the batch fails, all its cells stay edited and turn red, and the Write button turns red too — the write can be repeated. On success the button greys out again.
- Writing works only while the communication runs.
The written value is not shown immediately — the control shows only values read from the device. The new value appears after the next poll (periodic event) or after pressing Read (On Request).
Leaving write mode
- Read in write mode discards the pending edits, reads the current state from the device and keeps write mode on.
- Turning Write Mode off discards unsent edits and error states; the table keeps the last values read until the next poll. A write still in progress is cancelled silently.
- Switching Edit → Run turns write mode off and empties the table.
Clipboard and keyboard
- Ctrl+C (in both modes) — copies the selected cells in Excel format (tab between cells, new line between rows); in write mode it copies the edit text. The selection may contain multiple cells.
- Ctrl+V / Shift+Insert (write mode only) — pastes a block starting
at the top-left selected cell. The block must fit entirely into the
table; otherwise nothing is pasted and the header shows, on a red
background, a message of the form Paste refused: R x C cells do not
fit at row r, column c (table N x M). The message is also written to
the log (Warn level).
- A single copied value pasted over a multi-cell selection fills the whole selection.
- Empty clipboard cells and the table corner are skipped.
- Every pasted cell is marked as edited (yellow), even if its value did not change — send them with the Write button.
- Tab / Shift+Tab while editing commits the cell, moves to the next / previous one and opens it for editing.
- Enter commits the cell (and writes it with Write on Enter on). Arrow keys and F2 work as in an ordinary grid.
Next
Writing values also works for scalar variables — Writing values to the device.